Uploading ESP8266 or ESP32 Firmware OTA from Android

Using OTA firmware loading is rather useful for IoT devices once they are “in the wild”. I adopted the precaution of using a hardware jumper to enable OTA because my devices spend most of their time in deep sleep to save power. The down-side of this is that I need to visit the device before each upload. Rather than wander about with a laptop, I thought that using my phone would be more convenient. Setting this up and using is fairly straight-forward but took a bit of thinking-through and desk research. So, for others interested in doing the same…

Termux

The power-house is Termux, which runs a (command-line only) linux environment on your phone. I installed the APK from f-droid, which seems to be common practice over Google Play Store.

Install python with:

pkg install python

Working with phone storage is not as simple as you might think; see the termux wiki. For example, I believe it is not possible to see the filesystem which you see inside Termux when the phone is connected to a PC for file transfer. My operating procedure is to copy firmware binaries into the phone’s Downloads folder and then to use the file manager on my phone to move it over to the Termux “home” as described on the wiki page.

The second issue is that working on the phone screen is a pain! I had previously installed scrcpy for use in demoing some software and this works a treat in making life easier. Keyboard joy! This just works. Read the documentation about enabling USB debugging in developer mode.

Doing the OTA

I’m using ESP8266’s so downloaded the espota.py script from the esp8266/Arduino github repository. You just need the one file. I expect the same procedure as I describe here would also work for ESP32 users with otatool.py.

What follows is based on having created a new directory in the termux “home”, placing espota.py in that directory and then creating one directory for each kind of device, which contains a small Bash script and the firmware binary file. I am also using PlatformIO inside VSCode.

Compiled firmware can be found in the project folder at: .pio\build\{env}, where {env} is the environment name in platformio.ini. Use the firmware.bin file (not the .elf file).

Create the bash script for ease of use (I call it upload.sh), substituting xxx.xxx.xxx.xxx with the device IP address:

#!/bin/bash
python ../espota.py -d -i xxx.xxx.xxx.xxx -f firmware.bin

You can either use “nano” to edit these files inside Termux or move the .sh file between your phone and PC as noted above. Check the espota documentation for options to upload filesystem or if you’ve set up authentication.

Make it executable using:

chmod +x

This is simply run by using (in the appropriate directory):

./upload.sh

A nice modification if you have multiple devices of the same type is to change upload.sh to allow the IP address to be entered at run-time, in response to a prompt. All my devices are on the same subnet (192.168.1.x), so I only need enter the last component. The modified script is:

#!/bin/bash
read -p "Last part of IP address: "
python ../espota.py -d -i 192.168.1.$REPLY -f firmware.bin

Breakout Board for E18 Modules – DIY Zigbee at a Fraction of the Cost of an XBee

Having recently wanted to get my hands dirty with DIY Zigbee – see my other post on low cost DIY Zigbee – I couldn’t find any suitable breakout boards so, after having found the CC2530-based Ebyte E18-MS1 modules (which are rather economical and available from the manufacturer on Aliexpress… and seemingly without the curse of a glut of clones and fakes), I decided to make my own.

I wanted something quite simple but also flexible, with maximal scope for experimenting and learning. The main use case is to plug into breadboard but there was enough PCB space for some “convenience” components: two switches and three LEDs and associated resistors.

This is what it looked like once assembled (you can just see a BH1750 I2C light sensor on the rear):

Some notes on motivation, layout pragmatics, and options:

  • The long header is meant to be populated with right-angle pins. This will put the antenna nicely up and leaves plenty of space for other components on the breadboard (I find the breakouts with very wide dual-in-line pin-outs to be rather irritating, and Arduino style sockets and flying leads are not great when more than a few connections are to be made).
  • The 5 pin header is for firmware flashing. I opted for this, rather than the full 10 pin “debug” header which CCDebugger uses, for econonmy of space. These 5 pins are quite sufficient for using CCDebugger with TI SmartRF Flash Programmer (I made a little adapter) or if using something like Flash CC2531, which works fine for CC2530’s, (or my patched version for use with Pi v1 GPIOs).
  • The 4 pin header may be convenient for either UART or I2C connections. I’m expecting to be using PTVO and for the CC2530 it fixes UART pins to be P0.2 and P0.3. This header is meant to be mounted on the same side as the E18 module (opposite to switches).
    • The switches should be configured using the solder jumpers.
    • SJ1 handles the “Reset” button: A connects to E18 Reset; B connects to P0.0.
    • SJ2 handles the “Key” button: A connects to P0.1; B connects to P1.7 (which is used by the E18 factory firmware).
    • The on-board LEDs (and the enabling jumpers) visually correlate with the pins they are connected to: P0.4, P0.5, and P2.0.

Eagle design files are available on github but I am also currently (July 2023) selling surplus PCBs on ebay.

Debugging ESP8266 with GDB and VSCode + Platformio

VSCode with the Platformio IDE plugin makes for an excellent platform for developing ESP8266 code, especially using the Arduino Framework for ESP8266 but the Platformio debugging features do not work. It is, however, possible to use GDB together with VSCode and Plaformio to be able to single-step through code, inspecting flow of control and variable values as you go, in an experience that is comparable to VisualGDB but costs nothing.

There are some limitations, “gotchas”, etc, but once these are understood it really does work!

Setting Up Debug Compilation

The program must be compiled differently for debugging to work because additional information must be included, along with the GDBStub (see below). Once debugging is over, however, the firmware uploaded to the ESP8266 should not have this overhead.

Allowing for both options to be compiled and uploaded is easy in Platformio if you use platformio.ini environments. For example:

[env]
platform = espressif8266
framework = arduino
upload_port = COM15
upload_speed = 115200
monitor_port = ${env.upload_port}
monitor_speed = ${env.upload_speed}

[env:d1_mini_pro]
board = d1_mini_pro

[env:debug_d1_mini_pro]
board = d1_mini_pro
build_flags = -Og -ggdb3 -g3 -D WITH_GDB
Note that I have created two targets – “d1_mini_pro” and “debug_d1_mini_pro” – with the latter defining some non-default build_flags. The “-g” flags make the compiler include debug information, while -Og prevents the compiler optimising code (which breaks the nice relationship between lines of source code and compiled MCU code). I have also included “-D WITH_GDB”; the -D directive is equivalent to a “#define” in the source code and means we can use “#ifdef” to selectively include chunks of code depending on whether we’re using the debug_d1_mini_pro target or not.
Remember to recompile and upload before debugging any changes you make.

Adding GDBStub to Your Code

The GDBStub is code which executes on the ESP8266 to communicate with GDB running on your PC via the serial port. Serial.print() will still work so long as you avoid using a rapidly-repeating loop() which contains little more then Serial.print().

The Arduino Framework already contains the GDBStub code and their documentation explains the basics, although in the context of using the Arduino IDE.

Following on from the use of “WITH_GDB” in the previous section, add the following chunks of code.

At the top:

#ifdef WITH_GDB
#include <GDBStub.h>
#endif
At the start of setup():
  Serial.begin(115200);  // or whatever baud rate you prefer
  #ifdef WITH_GDB
  gdbstub_init();
  #endif

Command Line GDB

An essential truth is that you must use the correct gdb for the core processor of the ESP8266: xtensa-lx106-elf-gdb.exe. For my Platformio install, this can be found at (“~” denotes my home directory, i.e. C:\Users\Adam): ~/.platformio/packages/toolchain-xtensa/bin/xtensa-lx106-elf-gdb.exe

A second essential truth is that GDB needs to be set up correctly before you can actually debug. This is most easily done with a set of commands stored in a file, which I call “gdbcmds” and which should be created in the home folder of the Platformio project (i.e. in the same folder as platformio.ini). My gdbcmds file contains:

# ESP8266 HW limits the number of breakpoints/watchpoints
set remote hardware-breakpoint-limit 1
set remote hardware-watchpoint-limit 1
# Some GDBstub settings
set remote interrupt-on-connect on
set remote kill-packet off
set remote symbol-lookup-packet off
set remote verbose-resume-packet off
# The memory map, so GDB knows where it can install SW breakpoints
mem 0x20000000 0x3fefffff ro cache
mem 0x3ff00000 0x3fffffff rw
mem 0x40000000 0x400fffff ro cache
mem 0x40100000 0x4013ffff rw cache
mem 0x40140000 0x5fffffff ro cache
mem 0x60000000 0x60001fff rw
# Locate the ELF file
file .pio/build/debug_d1_mini_pro/firmware.elf
# Change the following to your serial port and baud
set serial baud 115200
target remote \\.\COM15

The ELF file location follows the pattern .pio/build/{target}/firmware.elf, where “{target}” matches the relevant entry in platformio.ini.

Obviously: change the serial port and baud rate!

Now open a new terminal in VSCode. It should open with the project home as the working directory (this is necessary). You can open a terminal window outside VSCode too (I like ConEMU) but should make sure the working directory is right.

You need to run xtensa-lx106-elf-gdb.exe, passing the commands file by adding “-x gdbcmds”. I tend to use a bash shell, so the command is:

~/.platformio/packages/toolchain-xtensa/bin/xtensa-lx106-elf-gdb.exe -x gdbcmds

If you prefer a normal Windows command prompt just replace the “~” with C:\Users\You.

If you get an error like “\\.\COM15: No such file or directory.” then you will have the Serial port open somewhere such as the “Monitor”. Close it.

I suggest you read the Arduino Framework notes for “what next”. The GDB documentation is available online but is rather long and has much which is not applicable. Generally useful commands are: thb (see below), next, step, finish, print, and info locals. Interesting to explore are: disassemble and frame.

When single-stepping (step or next), the execution will sometimes step over several lines of code.

Avoid resetting the device while a GDB session is connected; it gets rather confused!

ESP8266 Limitation – One Breakpoint

This causes things to get ugly if you don’t work with care. The first thing to do is to use temporary breakpoints. Rather than the normal “break” GDB command, use “thb”. This means that once the breakpoint has been reached it is deleted. Otherwise you need to use the “delete” command to remove the breakpoint.

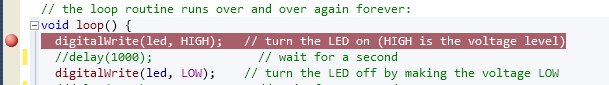
Typical uses are to break on entry to a function. So long as the function name is unique, something like “thb loop” works. Since the compiled code contains source from many files, line numbers must identify the file they relate to, so the command should be something like “thb src/main.cpp:25”.

“Visual” Debugging

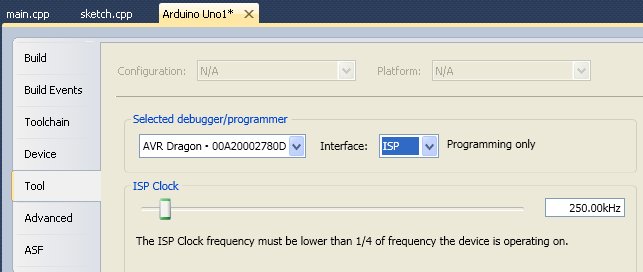
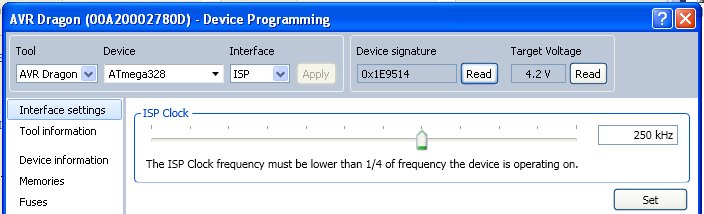
This is how to get the debugging experience more like what the Platformio and VisualGDB screenshots suggest.

The launch.json file (within the .vscode folder for the Platformio project) should be edited. Ignore the warning about this being an automatically-generated file and replace the platformio debug entries with the following:

{
    "version": "0.2.0",
    "configurations": [
        {
            "name": "GDB",
            "type": "cppdbg",
            "request": "launch",
            "program": "${workspaceFolder}/.pio/build/debug_d1_mini_pro/firmware.elf",
            "args": [],
            "stopAtEntry": false,
            "hardwareBreakpoints": {"require": true, "limit": 1},
            "cwd": "${workspaceFolder}",
            "environment": [],
            "externalConsole": true,
            "MIMode": "gdb",
            "miDebuggerPath": "${userHome}/.platformio/packages/toolchain-xtensa/bin/xtensa-lx106-elf-gdb.exe",
            "miDebuggerServerAddress": "\\\\.\\COM15",
            "setupCommands": [
                {"text": "set remote hardware-breakpoint-limit 1"},
                {"text": "set remote hardware-watchpoint-limit 1"},
                {"text": "set remote interrupt-on-connect on"},
                {"text": "set remote kill-packet off"},
                {"text": "set remote symbol-lookup-packet off"},
                {"text": "set remote verbose-resume-packet off"},
                {"text": "mem 0x20000000 0x3fefffff ro cache"},
                {"text": "mem 0x3ff00000 0x3fffffff rw"},
                {"text": "mem 0x40000000 0x400fffff ro cache"},
                {"text": "mem 0x40100000 0x4013ffff rw cache"},
                {"text": "mem 0x40140000 0x5fffffff ro cache"},
                {"text": "mem 0x60000000 0x60001fff rw"},
                {"text": "set serial baud 115200"}
            ]
        }
    ]
}

Note that: the entry for “program” will need changing to match your debug compilation target; the serial port appears as “miDebuggerServerAddress” and has additional back-slashes compared to the previous configuration.

This uses the “machine interface” to GDB, which you can see by adding “–interface=mi” after the “-x gdbcmds”. There is a Python package which can interpret the gdb/mi responses: pygdbmi.

You should now be able to use the “Run and Debug” feature of VSCode; there should be an entry called “GDB” (using the “Quick Access” Plaformio Debug > Start Debugging also seems to work but I avoid that route as I don’t know what else it might do). I won’t repeat information on using the VSCode debugging interface here; there is plenty on the web! You should be able to see variables and to inspect the call stack while stepping through the code. What I will provide are some caveats and gotcha-avoidance measures.

Remember there is only one breakpoint

Unfortunately, VSCode does not let you set temporary breakpoints. So you must adopt a working practice of setting a breakpoint and then deleting it as soon as you get there (the config line ‘”hardwareBreakpoints”: {“require”: true, “limit”: 1}’  prevents you from adding more than one, but it isn’t that simple! It appears that the VSCode gdb/mi implementation uses breakpoints for “step over” operations, so you really must delete the breakpoint before stepping. If you get horrible red boxes popping up reporting exceptions etc, the cause is likely to be because you have left a breakpoint.

Where is my Serial.print() output?

In spite of the debugger, I still find Serial.print() very useful for reporting sensor readings etc.

These appear in the Debug Console.

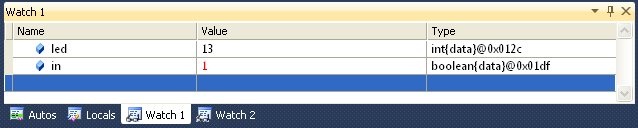
Not all variables are locals

Although the VARIABLES panel shows local variables (and changes these as you select different levels in the call stack), global variables will need you to issue the GDB print command. Locate the Debug Console and note that it has a command entry line at the bottom. GDB commands may be entered here, but must be prefixed by “-exec” (e.g. -exec print foo). You can also add these as WATCH entries.

Adding a breakpoint while things are running

Adding a breakpoint while the ESP8266 is running causes it to stop execution where it is, rather than where the breakpoint has been added. Simply use Continue (F5) to make it continue until the breakpoint is met.

Some things don’t work

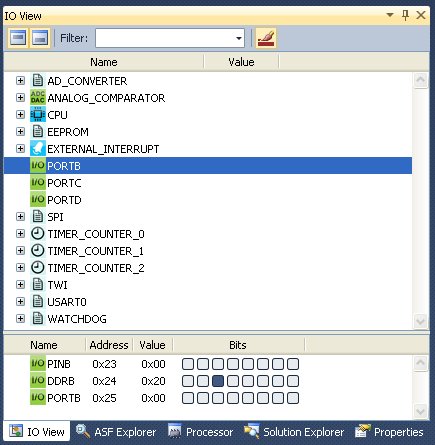
Although VSCode suggests otherwise, some things are not supported: PERIPHERALS, MEMORY, DISASSEMBLY.

The Debug Console command line entry comes to the rescue, e.g. try “-exec disassemble”.

Debugging Inside Setup

The problem with attempting to debug inside setup() is that the ESP8266 will normally have exited setup() before you connect GDB.

The neatest way of handling this is to add the following code into setup() just before you want to start debugging:

  #ifdef WITH_GDB
  gdb_do_break();
  #endif

When you reset the ESP8266, this triggers entry into the debugger on the ESP8266, which looks like a breakpoint hit, and means that when you connect GDB you find you are stopped inside gdb_do_break(). Send the “finish” command to GDB twice and you’ll be inside setup().

This works nicely with the command line use of GDB but I haven’t been able to find how to make the VSCode debugger play nicely with it. In this case, the quickest option is to use something like delay(3000) instead of gdb_do_break(). This gives you enough time to start the debugger after resetting the device.

Make sure you quit any GDB session before resetting; things get all messed up otherwise.

Setting Variables

GDB permits variable setting through commands such as “set var my_var = 5”.

Unfortunately, this does not always work. Various comments on the web suggest this comes down to where the variable data is to be found when the program is running, because GDBStub cannot access all possible places.

A work-around is to declare variables with the “volatile” keyword.

Sonoff Basic R3 – DIY Switch via HTTP POST of JSON

The latest firmware of the Sonoff BasicR3 Wifi Switch now allows the device to be controlled through the DIY mode built into its firmware (v3.6.0) without any re-flashing with Tasmota firmware or fooling about with jumpers. The only obvious limitation for some people is that the “eWeLink” app and DIY access cannot both be used together; the switch is either in DIY mode or app-control mode. This is not an issue for me as I have no requirement for remote control from outside my LAN and don’t intend to use the app at all. In any case it would not be hard to either use a general purpose HTTP “shortcuts” app (e.g. HTTP Shortcuts!) for control from a phone from my LAN, or to write/run my own web app of a Raspberry Pi. I begin to digress… the point of this post is to make some notes for myself in a way which someone else might find useful (and adding some extra helpful comments). Much of what follows can be found on the web, but there are some holes, and I didn’t find the documentation quick and easy in parts.

Getting into DIY Mode

The key is to get the device into what the Sonoff User Manual calls “Compatible Pairing Mode”. The push button is used in two stages, with long (5s) holds, first to get the LED signalling “..-” and then again to get continuous rapid flashing.

The switch is now acting as a WiFi access point with SSID (name) of “ITEAD-{device_id}”, where device_id will be something like “100136da83”. Connect to this network using the network security key 12345678 and then visit http://10.10.7.1 to access a web page which allows you to enter your own WiFi SSID and password. After a short while, the Sonoff device will have closed its access point and connected to your local network. It is now in DIY mode, and will stay this way when its power supply is disconnected and reconnected. The LED will signal “..”. You can still use the eWeLink app to add the switch to its device list, but this cancels the DIY mode. Also: once in DIY mode, you cannot access http://10.10.7.1, no matter how many times you force the device into making “ITEAD-{device_id}” available. The exception to this is if you power the switch up so it cannot connect to your local network. In which case, the device will eventually (20s) give up trying to connect and become eligible to be forced into Compatible Pairing Mode again.

Finding the Device on the Network

This is not as simple as it might be; it would have been neater if the http://10.10.7.1 web page reported its network name before disappearing. This is a bit messy.

Option 1 is to look at the client list in your router admin web interface. This is likely to require the “advanced” option. In my case, my modem-router does provide a client list, but rather confusingly the client name which is reported, and the MAC address have no obvious connection with the device_id revealed above. The client name is like “ESP_80DD76”, which is the standard way an ESP8266 (etc) chip reports its name, which takes the last 3 bytes of the MAC address prefixed by “ESP_”. If you can see something like this, you’ve found the IP address and can progress to the “Control the Switch” section, below, although you will have to trust that the default port is used (I see no reason why it would not be).

Option 2 is to use an mDNS browser. The essence of mDNS is a service which links device names to IP addresses and other info. MS Windows doesn’t seem to have an easy way to do this, but if you also run a Raspberry Pi it is not hard. Mac users can use Bonjour, there are Android Apps, and linux users (of course) can do as follows anyway. The service/tool for the Pi is Avahi. This should already be up and running, which can be confirmed using “service avahi-daemon status”. The mDNS browser requires the avahi-utils package, which was not on my Pi, but installed with “sudo apt-get install avahi-utils”. The simple command is not “avahi-browse –all –resolve”, which will reveal that the mDNS name is of the form “eWeLink_{device_id}.local”. The port entry will report which TCP port should be used to connect to the device, which should be the default of 8081. The txt entry reveals the device state if in DIY mode, or a base-64 string of gobbledy-gook if in eWeLink app mode.

Option 2a is an Android App. I tried one called Service Browser, but there are other mDNS browsers

Option 3 is to take advantage of the observation that the mDNS name is of the form “eWeLink_{device_id}.local”. This is fine so long as your method of controlling the switch can work with mDNS names, which Postman cannot (at present).

Caveat: there is no guarantee that your router will assign the same IP address. In my case, I operate a router which allows “address reservation”, so that several IoT devices I have get known IP addresses. Unless your router has this feature, beyond tinkering, you will have to resort to using mDNS-aware software. If writing your own in Python, it looks like the “zeroconf” package is suitable for dealing with mDNS names and not worrying about reliable IP addresses.

Control the Switch

I use Postman for manual testing, and Python for anything automated.

The documentation for interacting with the device is fairly good, and can be found at https://sonoff.tech/sonoff-diy-developer-documentation-basicr3-rfr3-mini-http-api/. This includes info on how to perform an OTA (“over the air”) firmware update, control how the device behaves when its power is restored (allowing you to choose whether it starts up off, on, or in its previous state), and to change the WiFI SSID and password which the device connects to, but I’m content with the info, on, off, and pulse options.

Note that all messages to the device are HTTP (not HTTPS) POST operations, with a JSON body (payload). Although the documentation includes “deviceid” in the JSON, this is completely redundant and can be omitted.

Summary:

Operation URL JSON Body
Info http://{{ip_addr}}:{{port}}/zeroconf/info
{
 "data": {}
}
On http://{{ip_addr}}:{{port}}/zeroconf/switch
{
  "data": { 
    "switch": "on" 
  }
}
Off http://{{ip_addr}}:{{port}}/zeroconf/switch
{
  "data": { 
    "switch": "off" 
  }
}
Pulse http://{{ip_addr}}:{{port}}/zeroconf/pulse
{ 
  "data": { 
    "pulse": "on", 
    "pulseWidth": 2000
  }
}

Pulse changes the behaviour of “On” operations; if Pulse is on then an “On” operation will only last for pulseWidth milliseconds, after which the device will turn off again. The maximum duration is 1 hour. The JSON payload for Pulse can omit the “pulseWidth” to enable/disable the feature, but it is not possible to change the pulse duration by only specifying “pulseWidth”.

Using MQTT in Open Energy Monitor to Capture External Device Data

I struggled to find clear and well-organised information about this using web searches, so here is a condensed “how to”. The scenario I have is using a home-brew ESP8266 based device attached to my solar PV inverter which I want to relay definitive power output to my Open Energy Monitor via MQTT. This seems quite simple in principle, and is simple in practice, but seemingly not well documented.

First thing is to publish the data to an MQTT broker on the emonpi with a topic which starts “emon/{source}/{key}”, replacing {source} with a suitable name for the data source and {key} with the attribute name for the data being sent. In my case, I used “emon/solis/power” as the data source is the output power for my Solis PV inverter. The message payload is simply the data value. This immediately makes the published data appear on the “Inputs” screen of EmonCMS.

Two refinements/possibilities:

Send JSON

Rather than just a single value, send several in the same message. There are two ways to do this:

a) use a topic of form “emon/{source}”

b) use a topic of form “emon/{source}/{key}”

If the message payload sent to the MQTT topic “emon/solis/power” looks like {“ac”: 90, “dc”: 120}, option (a) creates EmonCMS inputs “ac” and “dc” under “solis”, while option (b) creates inputs called “power_ac” and “power_dc”.

Include a timestamp

To do this, simply include an extra field in the JSON called “time”, with a value which is the Unix time. If you are testing, the Unix time needs to be fairly close to the actual time (ignoring summer time) otherwise EmonCMS will indicate “inactive”, but it still captures the data.


Aside: I used the VSMqtt plugin for VSCode as the MQTT client, as I’m using the PlatformIO plugin to develop my ESP8266 code (using the Arduino libraries). Update: these days I’ve changed to using MQTT Explorer as my go-to software for viewing MQTT messages.

Safe Use of GPIO on ESP8266 NodeMCU Boards

It is well known that, unlike a Raspberry Pi or old-school Arduino, the ESP8266 has some quirks which make using the broken-out pins D0-D8 non-trivial. Google/Bing/etc will easily confirm this. I have, however found lots of long winded, unclear, and conflicting information. This post is my aide memoir, shared in case anyone else might find it useful. The hardware platform is “HW-628 V1.1”, from one of the many cheap Chinese sellers on Alibaba. I’m using the Arduino libraries with PlatformIO (within VSCode), but would expect the same results using the Arduino IDE.

My baseline assumption is that inputs and outputs will normally be used in “active low” mode, with INPUT_PULLUP used as the pinMode for inputs. There are two problems which will easily be found without care: 1) [as outputs] some pins are driven low on boot, usually with quite a few pulses, which will cause an active low relay to stutter; 2) [as inputs] holding some pins low will block the booting.

Tests for the effect of booting (and flashing) on output states were undertaken using a logic analyser (an Open Bench Logic Sniffer with OLS software) with a weak pull-up on the pin under test. I am using the D0-D8 notation as marked on the NodeMCU board. The Arduino library pin numbers differ, but the mapping is widely published.

The following pins were found to be OK to use without any restrictions, as inputs or outputs: D0, D1, D2, D5, D6, D7. The only caveat for my hardware is that D0 is connected to one of the on-board LEDs (active low).

The following CANNOT be used as outputs (with the exception of LED signalling*) since they are affected on boot (and when flashing): D3, D4, D8. D8 was found to hold a low value during flashing and during and slightly after the reset pulse. D3 and D4 showed a burst of pulses. You might get away with using D8 in its “TX2” UART alter ego since the flash/boot glitch wont make a valid data frame. [* – the NodeMCU Devkit board I have does have an LED on D4 = GPIO2 and this can be used for signalling from programmes].

D3, D4, and D8 can be used as inputs but only with some care:

  • D3 and D4 can be used as active low inputs only AFTER the boot sequence is completed. Push-switch inputs would be safe. Anything which would pull these pins low on boot will block it. D4 is connected to the on-board LED which is marked “COM” (and is active low).
  • D8 can be used as an active high input only AFTER the boot sequence. Push-switch inputs would be safe. I would use this last as I don’t like circuits to contain a mix of active low and active high inputs; logic should normally be consistent to reduce bug risk.
  • Since these GPIOs have output functions during boot and flashing, if there is a chance that a push switch input would be operated during those states, the switch should connect to ground or supply via a current limiting resistor.

An aside: when setting pins as outputs with pinMode, it is worth setting the output value to HIGH with digitalWrite() BEFORE changing the mode from its default as an input. Otherwise, assuming active low working again, you will be likely to see an output glitch due to a default low state pertaining when the pinMode() is applied.

Xmega DFU Bootloader – Changing the Sensing Pin

The DFU bootloaders that Atmel supplies, as Intel HEX files, for its Xmegas have pre-determined pins used to sense whether or not to skip the bootloader and start the application, or to register the device to the host PC via USB. These are slightly hidden on the Atmel website and the source code requires IAR to compile it (and an easy port to AVR-GCC is thought to be impossible on size grounds). A number of threads on AVRFreaks have discussed this matter, including: “Building bootloader for ATXMega16A4U from avr1916.zip” and “Where’s the DFU bootloader?“. I didn’t fancy installing IAR, but was intrigued by comments about dis-assembling the HEX files and tweaking bytes. The process was not explained, but in spite of starting off totally “in the dark”, an evening of fumbling and fiddling got me through to a result that worked. This post explains the process, in case anyone else wants to do the same. It is also my notes-to-self for when I forget!

Background

The Atmel application note AVR1916 has essential background info and the associated zip file contains the Intel HEX files for different xmega chips. The zip file also contains source code but: a) this needs IAR (see intro); b) it is deeply hard to follow!

Atmel AVR1916: USB DFU Boot Loader for Atmel XMEGA: pdf zip

The zip file is not so easy to find by google/bing; you pretty much have to go to the Atmel site, find the xmega section, go to documents, and select “application notes” from the drop-down.

Tools

There are probably lots of options, but I used:

  • avr-objdump, which is part of the avr-gcc toolchain. I used a recent toolchain download from the Atmel site. If you use Atmel Studio, look in {install directory}\Atmel Toolchain\AVR8 GCC\Native\3.4.1061\avr8-gnu-toolchain\bin.
  • Tiny Hexer by Markus Stephany. This is available from numerous places on the web, although not from the author’s original site mirkes.de .

Procedure

In what follows, I am dealing with an ATxmega32A4U. The method should translate to other chips very easily. I am ONLY concerned with changing which pin is sensed on a hardware reset to determine whether to start the application or wait for USB communication of a new application.

From a command window, execute:

avr-objdump -m avr -D file.hex >> disassembly.txt

That looks somewhat daunting to a non-assembler hobbyist person like me but it turns out not to be quite as bad as all that. The key thing to note is that we’re looking for references to a single I/O pin. Which pin it is may be found in AVR1916.

Default pin configuration table from AVR1916.
Default boot-sensing pin configuration table from AVR1916.

So, for my target it is Port C, pin 3. Consulting the xmega manual…

Base IO memory map addresses for the GPIO ports.
IO port memory map offsets (apply to all ports, simply add to the base address for the port to get the address of the appropriate register)

So, setting the direction for port C will address 0x0640 (offset is 0) and PIN3CTRL will be at 0x0653 (offset is 0x13).

To cut a long story short, the important lines in the disassembly are:

    800a:    f0 92 40 06     sts    0x0640, r15
...
    8010:    00 93 53 06     sts    0x0653, r16
...
    801c:    00 91 48 06     lds    r16, 0x0648
    8020:    03 ff           sbrs    r16, 3
...
    80de:    f0 92 53 06     sts    0x0653, r15

As an exercise, work out which registers are being accessed. The STS and LDS commands are direct store and load instructions. SBRS is “skip if bit in register is set”. In this case we can see bit 3 is being used, which is as it should be, and the value in register 16 is the IN value for the port.

Suppose we want to change the sensing pin to be Port D pin4 (physically pin 24 on a 44 pin xmega). This indicates a base address of 0x0660 and changing the instructions to:

STS  0x0660, R15
...
STS  0x0674, R16
...
LDS  R16, 0x0668
SBRS R16, 4
...
STS  0x0674, R15

Open Tiny Hexer and import the Intel Hex file appropriate to your chip from the AVR1916 zip file. Now it is just a case of changing the hex representation of the appropriate bytes. Note that the byte order of 0x0640 is reversed in the disassembly and in the HEX file. Here are some screenshots of Tiny Hexer after changing the required bytes:

tinyhexer1

Now export from Tiny Hexer as Intel HEX, saving with a new name (!).

At this point, it is a good idea to run avr-objdump again, on the new HEX file, to make sure that it still makes sense to an AVR. I also did a file-diff on the new vs original disassembled files. The results are as follows, although there is also a block of FF that got inserted between code blocks. This has no effect, and simply reflects the fact that Tiny Hexer exported a continuous block rather than two blocks with a space in between.

Compare PC3 PD4 a

Compare PC3 PD4 b

Looks like I got it right! Only the instructions I wanted to change got changed, and the flash memory addresses came out correct for a bootloader.

All that remains is to program this onto the chip with your programmer of choice (I use the Olimex AVR-ISP-MK2 clone since my Dragon utterly fails to even get the device ID 95% of the time), making sure the BOOTRST flag is correctly set if it is a new chip. Erase the chip, program and go!

A Cheat

If you can find two HEX DFU bootloader files for the same target chip, but with different sensing pins, a quick thing to do is to disassemble both and do a diff. I bet they will be from the same basic source code, and will quickly reveal which instructions need changing. Confession: that is how I got started on this problem.

Uploading Using DFU

To be honest, I think FLIP is a bit rubbish, and using the command line batchisp.exe is a pain in the arse. I’ve found dfu-programmer to be much nicer to play with (although the 0.7.1 version does contain a bug that fails to account for the xmega bootloader living in separate flash and so reduces the available flash for applications; this is fixed in 0.7.2 but is not released AFAIK at the time of writing).

I use dfu-programmer from Atmel Studio as an “external tool” via a small “bat file” command script.

In Atmel studio, point the external tool command at the .bat file and add the following into the “arguments” slot:

"$(ProjectDir)Debug\$(ItemFileName).hex" atxmega32a4u

To work, you do need to select the project file with the same name as the hex file before invoking the tool.

My .bat file just contains:

@echo off
REM supply the hex file location as 1st argument e.g. "dfu-programmer script argument blink.hex",
REM supply the target device as the 2nd arg e.g. atxmega32a4u

ECHO Erase, flash %1 and application launch.
ECHO Device = %2
ECHO ==========================================================
ECHO.

SET PATH=%PATH%;C:\Users\Adam\Desktop\dfu-programmer
dfu-programmer %2 erase --force
dfu-programmer %2 flash %1 --debug 2
dfu-programmer %2 launch --no-reset
ECHO -----------------------------------------------------------

Further Adventure?

I have not done this, but see this line:

    800e:    08 e1           ldi    r16, 0x18    ; 24

That is setting the value of register 16, which is immediately stored to PIN3CTRL in the original code. A quick look at the datasheet shows that, as expected, this is setting a pull-up on Port C pin 3. Fancy changing that?

… Or maybe change the SBRS to SBRC ?

AVR Dragon Problem: stopped working, not recognised by USB

OK… so my Dragon just stopped working. Plug it in, the status LED just flashes amber and Windows (XP) does not detect it. Re-install the drivers – no, that isn’t it. (BTW, the instructions in the helpfile that comes with Atmel Studio 6 are wrong). Try another PC or using a motherboard USB socket rather than the hub – no, wrong again. Try a different USB cable – nope.

The answer, it seems is to use a USB hub but to do so with the hub’s separate power adapter. After that, I was able to dispense with the power adapter and the Dragon kept working, even after unplugging/re-connecting.

Wierd! There are a number of suggestions on the web that the Dragon draws a heavy current on startup,  so I guess it got into “a bit of a state.”


Debugging Arduino using debugWire (+ Atmel Studio and an AVR Dragon)

This post is motivated by the lack of information about using debugWire with an Arduino (or similar) on the web. There are quite a few brief comments on the forums and people asking how to do it but nothing really good, with the possible exception of a post by Steve Cogswell which refers to an old version of Arduino and an old version of Atmel Studio.

This really notes for myself for next time, when I’m bound to have forgotten the recipe, but I hope someone else will find it useful. The previous post describes how to get started with using the Atmel Studio simulator, which is a good introduction to the activities required during on-chip debugging (OCD) without needing to fiddle quite so much and without wondering whether the hardware is playing nicely.

What Can You Do with debugWire?

Inspect memory, single-step through code, set break-points (at which execution will stop), inspect registers and input/output port values etc. i.e. as for the simulator, but for the real hardware.

Pre-requisites

This assumes you have:

  • an Arduino Uno
  • Atmel Studio 6 (Windows only but you could try using it from inside VirtualBox if you are a linux or Mac user – I’ve had a good experience of VirtualBox on Ubuntu, although I’ve not tried Atmel Studio )
  • an AVR Dragon (a fairly cheap USB programmer/on-chip-debugger) and a 6-way cable to connect it.

I also recommend you get the ATMega328 data sheet.

Preparing the Hardware

The ATMega328 data sheet says:

• Capacitors connected to the RESET pin must be disconnected when using debugWire.
• All external reset sources must be disconnected.

If you check the Arduino Schematic, you will see that there IS a 100nF capacitor connected to RESET. This is used to cause a reset to be triggered when communication is initiated via the USB. This is normally useful since a reset is needed to prompt the bootloader on the Arduino to receive compiled code in the upload process.

In the older Arduinos you had to remove the capacitor (as per Steve Cogswell’s post) but on the Uno there is a bit of circuit board track specially prepared for cutting and re-soldering later if need be. If you leave it cut then it will be necessary to manually press the reset button just as the Arduino IDE (or avrdude) tries to start an upload.

RESET EN marks the place you need to cut (between the two solder pads)

Preparing the Software

This is basically just a case of compiling the code for the Arduino in Atmel Studio as I’ve previously described. It is NOT necessary to upload the compiled code using avrdude because Atmel Studio will do this for us via debugWire.

Preparing the Hardware

Connect the Dragon ISP header to the Arduino ISP header. Note that pin1 connects to pin1 on the other device, i.e. MISO connects to MISO. Both Dragon and Ardiuno are separately powered through their USB connectors and the Dragon senses the Arduino’s power supply voltage through the 6-way connector.

Select the Dragon as the tool to use

Open the device programmer using Tools|Device Programming menu or: program button.

Make sure Tool, Device and Interface are correct then click "Apply" to connect.
Make sure Tool, Device and Interface are correct then click “Apply”.

You can also “Read” the device signature to confirm that the physical device matches the one chosen in Atmel Studio. This will happen automatically later on anyway and Atmel Studio will block you if it isn’t right.

Warning… and Being Prepared

As described in Steve Cogswell’s post, it is possible to make a non-permanent mess of the ATMega328. It may be necessary to use the “HV” programming on the AVR Dragon if the ATMega gets stuck in debugWire mode and it may be necessary to re-install the boot-loader. These are not difficult if you have an AVR Dragon (or presumably other programmers too).

It can be useful if you need to recover from mishap, and is generally a good plan, I think, to get the fuse settings BEFORE messing about with debugWire and before fiddling with them. All you need to convert a factory fresh ATMega328 into something usable on an Arduino board is to set the fuses correctly and to program the boot loader.

Use "Copy to clipboard" and save the fuse settings somewhere save. Do the same for the Lock bits.
Use “Copy to clipboard” and save the fuse settings somewhere save. Do the same for the Lock bits.

The debugWire Cycle

This is the sequence of operations I have found works reliably. Try this with “Blink” (if you’ve carried on from the simulation example, remember to replace the delay() lines). NB: step 7 is important to get your chip back into its normal state.

  1. Program the DWEN fuse: make sure the box is ticked then click “Program”.
  2. Cycle the power on the Arduino by temporarily disconnecting the USB connector. At this point, you can probably no longer use the ISP interface.
  3. Set debugWire as the interface (see screenshot below)
  4. Click “Start Debugging and Break” or hit Alt+F5 or set a break-point then “Start Debugging” (F5). Note: this uploads the program too.
  5. Set break-points, single-step etc. Use the “IO View” to manually change the value of output pins on the Arduino, yes, the real ones!
  6. Stop debugging (Ctrl+Shift+F5), change the code and return to step 4.
  7. Menu “Debug|Disable debugWIRE and close”. This menu item is only accessible when debugging so you may need to use F5 again. The DWEN flag will now be reset and you will be able to use the ISP interface again.
Set the interface to debugWIRE
Set the interface to debugWIRE (step 3)

Now compare the fuses and lock-bits to the previously saved settings. They should be identical. debugWIRE should also have preserved the bootloader so it should be possible to go back to the Arduino IDE; you only need to remember to press the Arduino reset button just as the IDE announces it is uploading in order that the bootloader executes.

Simulating Arduino Code using Atmel Studio 6

The next post will look at on-chip-debugging (OCD) but it is worth using the Atmel Studio Simulator first. Using the simulator isn’t practical unless the input-output is pretty simple because it doesn’t simulate attached devices or real-time events. But even so, you can fiddle with input/output at the bit level and follow the way variables in the code change as it executes. This is MUCH smarter than using Serial.println() because once you’ve mastered Atmel Studio, you can save plenty of time. And poking about with the simulator helps to make sense of what is going on inside code such as “int led=13” or “digitalWrite(12, HIGH)”. All clean fun, and you don’t need any hardware other than a PC.

This starts off as just a case of compiling the code in Atmel Studio so you can set break-points or step line-by-line through the code to see what happens. See an earlier post of mine for how to get an Arduno sketch to become an Atmel Studio 6 project or just download the Atmel Studio project to match the following.

device
First make sure you have selected the right target device
choose_simulator
Then choose the simulator as the device

I have the “device and debugger toolbar” permanently enabled: device and debugger toolbar.

Tracing Input/Output

I’m going to use “blink” with delay() commented out because I have also found that use of delay() causes problems. Real time stuff doesn’t make sense in a step-through simulator anyway.

Set a breakpoint by clicking in the margin
Set a break-point by clicking in the margin

Now just hit F5 (or the green “play” icon) , watch the compile and wait for the break-point line to become highlighted in yellow. Now make sure the “IO View” is open. Use F10 to step through lines or the “Step Over” icon. If you F11/”Step Into”, you will end up inside the code that implements digitalWrite().

IO View showing PORTB inputs/outputs, which includes Arduino pin 13 as "bit 5"
IO View showing PORTB inputs/outputs, which includes Arduino pin 13 as “bit 5”. DDRB is set because pin13 is defined as an output. The bottom row is the output. PINB is the input value, which just follows the output.

Step through and watch bit 5 change, with nice highlighting in red. You can also click on it to change the value manually. I tend to use keyboard shortcuts but you might prefer the toolbar: step toolbar (watch, step-into, step-over and step-out). Step-Out is handy if you accidentally Step-Into the code for digitalWrite(), for example.

It should be an easy step to modify blink to read pin11 and write the value to pin12. Which bits of PORTB are these? Click on the appropriate bit in the PINB row to set the input value as high or low and step through to see it propagate to the output. Does it work if pin11 is set as an output (DDRB is set for that bit)?

Watching CPU Clock Cycles

Open the Processor view and watch the “Cycle Counter” as you step through. Changes in this indicate how many CPU clock cycles were needed to execute the line(s) of code. You can over-type the value to zero. At 16MHz clock, each cycle is 1/16,000,000s long so it how long does it take for the two digitalWrite()s in blink to execute?

Processor View is a little cryptic except for Cycle Counter

 Watching Variables

Declare a boolean called “in” and read pin 11 into “in” before doing a digitalWrite(12, in). Now select the text “in” and add a “QuickWatch” (Shift F9 or click the glasses icon). Step through as before, manually changing bit 3 (pin 11) in “IO View”. NB: you can manually change values in the “Watch 1” tab too.

The result of a QuickWatch of both "led" and "in", which has just changed to 1
The result of a QuickWatch of both “led” and “in”, which has just changed to 1

OK… that was too simple but… Now find the “Memory 1” view (try Debug|Windows menu) and select “Memory: data IRAM”. Step through again and see if you can see which memory byte stores the value of “in”. Hint: in my case it was address 0x01df. Now add a QuickWatch for “led”, find the memory location and check its value is 0x0d (i.e. hexadecimal for 13 in decimal). See what happens in the Memory view if you change the value of “led” in Watch 1 to be -1 or 512. It should be clear that “led” uses two bytes of storage (check the Arduino reference and it says “Integers …  store a 2 byte value. This yields a range of -32,768 to 32,767”).