Using Z-Stack ZNP to Make DIY Zigbee Devices to Work With Zigbee2MQTT

Z-Stack ZNP (Zigbee Network Processor) allows you to make a Zigbee device by running ZNP on the Zigbee chip (CC2530 etc) and a microcontroller to read sensors, actuate motors, display stuff etc, using a basic communication protocol (UART serial or SPI) between the two. This saves you from having to compile code for the Zigbee chip (which requires a costly IDE for the CC2530) and means you can, for example, work with user-friendly libraries such as Arduino (whether for Arduino hardware, ESP8266, etc…).

Unfortunately, the documentation for ZNP is not great. Information is spread over several documents. There are errors. There is a distinct lack of information which “walks you through”. This article is my notes on how I got things to work, with a few caveats: I am working with a Zigbee2MQTT environment running @KoenKK’s Z-Stack HA 1.2 coordinator firmware and am explicitly working only within the scope of the Zigbee 1.2 Home Automation Profile on a CC2530 device. I see no reason why what follows could not be applied to Zigbee 3 or to chips other than CC2530 with a few tweaks.

Getting Started

Download Z-Stack Home 1.2 from the Texas Instruments Z-Stack archive (it should be the one named “Z-STACK-HOMEZigBee Home Automation Solutions“, with an installer file name of “Z-Stack_Home_1.2.2a.exe”. This provides you with the Z-Tool and some documentation. Do not use the firmware included! There is source code, which can sometimes be useful to work out details which the documentation does not explain.

Download the @KoenKK Home 1.2 coordinator firmware for your hardware (CC2530 etc). This is almost the same as the ZNP firmware available in the TI Z-Stack download but has a few modifications and different compiler flags set. These differences are essential! Although this is designated as “coordinator”, it is possible to change the role to end-device using ZNP. This is what we’ll do.

I’m using my E18 boards (see my E18 breakout post), but any basic development board based around the same CC2530 chip should work just the same, so long as it exposes the UART pins (see below). Ebyte sell a dev board with an E18 already mounted and an onboard USB-serial converter (but you will need to use jumper wires to connect the the CC2530 UART I/O to this). I will use “ZNP board” to refer to this hardware.

Flash the ZNP board with the @KoenKK firmware.

I’ll be using Zigbee2MQTT (hereafter “Z2M” and the ZBOSS/Wireshark sniffer as I outline my DIY Zigbee post. The sniffer is very useful for observing the sequence and content of messages and will helpfully show when you try to send malformed messages (these are often not reported by ZNP, which cheerfully responds with “success” messages).

For the purposes of exploration and learning, I use a PC to communicate with the ZNP board, rather than a micro-controller. This makes it much easier to experiment, while knowing that the same UART messages send from a MCU would have the same effect.

The system outline is: [PC – USB/Serial adapter] << UART serial >> [ZNP board] << Zigbee wireless >> [Zigbee coordinator dongle] << serial tty >> [Zigbee2MQTT].

At the PC end, the ZNP commands can be generated and sent “as you please”. I used Z-Tool (see below), some Python code, and (mostly just to show it worked) Termite with the “hexadecimal view” filter, my favourite serial terminal. ZNP commands are just a bunch of bytes!

While the TI ZNP firmware is compiled to require hardware flow control (which Arduino libraries do not have), and to require configuration (SPI vs UART) via a hardware pin, the @KoenKK does not (see the “patch” file in the github repo if you are interested to see the changes). It only supports UART comms and uses P0.2 for RX and P0.3 for TX. Remember to cross-over TX and RX between the USB-serial adapter and the ZNP board. It also exposes four GPIOs via ZNP on P0.6, P0.7, P1.6, and P1.7.

Unfortunately, the UART comms option doesn’t come with any power saving support, whereas the SPI option does (although how effective it is I do not know). The bottom line is that the ZNP board seems to draw a continuous 23mA  approx, which would be hopeless for a battery device. For a sensor/output-oriented device it would be feasible to use a MOSFET to kill the power to the E18 before putting the MCU to sleep, but devices which should be remote-controlled or queried will just have to be mains powered. I don’t suppose this is such a big deal as such devices are likely to have more energy consumption than a battery is likely to be suitable for.

Note: I will use “Termite” to mean “use the serial terminal of your choice” and “Wireshark” to mean “use the Zigbee sniffer of your choice”.

Documents

The main references which I found to be useful, specifically those relevant to HA 1.2, are:

[R1] “Z-Stack ZNP Interface Specification” – outline of ZNP, esp the physical interface (for various SoCs and devkits) and message frame structure.

[R2] “Z-Stack Monitor and Test API” – basic message and response structure for commands shown in Z-tool (except the Simple API). This is the core reference for ZNP message structures.

[R3] “Z-Stack Simple API” – general description of Simple API + index of configuration ids.

[R4] “Developing a ZigBee System Using CC2530 ZNP” – this contains a very useful walkthough of ZNP commands but doesn’t explain much. (Lamentably, TI seem to have removed this from their online document library.)

[R5] “ZigBee Home Automation Application Profile” – contains prescribed profile Id, device Ids, and cluster Ids applicable to HA 1.2. There is also a more recent Zigbee Cluster Library specification [R6] which is applicable to Zigbee 3.0 (and will surely have incompatible elements alongside stuff which works!). HOWEVER: this HA profile does not document the ZCL frame structure or the Basic Cluster attributes; there is presumably a Z1.2 document for these… but [R6] seems good enough. (Lamentably, the Zigbee Alliance, now CSA, no longer make this available. Bad people!)

[R6] “07-5123-08-Zigbee-Cluster-Library” – revision 8 of the Zigbee Cluster Library, aka “ZCL”.

[R1] to [R3] may be found in the Documents folder of the Z-Stack installation.

First Test – Termite and Z-Tool

Having connected P0.2 and P0.3 as noted above, connect with Termite at 115200 baud (at this point it is best not to have the sniffer dongle also attached, so you can easily see which the correct serial port is). Hit the ZNP board reset button and watch for its reset indication message to appear in Termite. This message is called “SYS_RESET_RESPONSE” (but some of the documentation calls it “SYS_RESET_IND”). Note that the message is framed: there is a “start of frame” (SOF) byte 0xfe, followed by the message body, and terminated by a single “FCS” checksum byte. The checksum uses the XOR8 algorithm (look it up). The message body starts with 1 length byte, followed by a 2 byte command and then a variable length of data. Review the message alongside the documentation for the message frame structure and the SYS_RESET_RESPONSE message type. Get some paper and check the checksum! Note that the command id (0x4180) is useful for looking up in the documentation when the “friendly” name has been changed.

The same message structure is the basis for all ZNP messages.

Close Termite’s connection to the serial port and start up Z-tool (it can be found in the Tools folder of the Z-Stack installation). Unfortunately, Z-tool defaults to the wrong baud rate. Look in Tools > Settings and change it to 115200 for the serial port in question. The setting persists for each serial port.

It should scan for and find your device (use Tools > Scan for devices to repeat the scan). It can take a while for the ZNP board to become visible on a cold start, but it should come up quickly once you’ve seen it appear in Termite. Hit the ZNP board reset button again and correlate the Z-Tool presentation with the raw serial message in Termite.

Now experiment with a few simple commands such as SYS_VERSION, SYS_PING, and SYS_RESET. UTIL_GET_DEVICE_INFO is also quite informative. You should be able to see the hardware MAC address (aka IEEEAddr) and the ShortAddress, which is used within the PAN. DeviceType is a little confusing; it shows the roles the firmware is capable of operating as, rather than the role which it currently has. The DeviceState for an unjoined device should be 0 = “DEV_HOLD”. More on device states later.

If feeling adventurous, wire some LEDs to the GPIO pins mentioned above and experiment with UTIL_LED_CONTROL and SYS_GPIO (you will definitely need to read the documentation carefully). Note that some SYS_GPIO settings interfere with UTIL_LED_CONTROL.

Also: try composing raw byte sequences using Termite, remembering the SOF and FCS bytes. You will find that ZNP will not respond if you make a mistake; in general, do not expect to receive an error message but DO expect to receive an explicit response message. The response might be a simple “success” response, some data, or a deferred indicator/callback as for the case of a restart.

None of these ZNP messages have gone beyond the ZNP board; they are only communicating with the ZNP firmware.

Preparing the ZNP Board as an End Device

So far, the ZNP board still thinks it is a coordinator; some configuration settings must be changed.

First, though, we should give some thought to the start-up procedure. Whether we’re thinking of a PC or a MCU communicating with the ZNP board, we need to know when it is ready. Refer to [R1]. In practice this amounts to waiting for SYS_RESET_RESPONSE (command id 0x4180) before attempting to send ZNP messages.

Although this configutation is only needed once, I think it makes sense to execute these commands with a script each time I change anything. For an MCU-based device in use, I would not normally perform these steps unless a jumper or button is active at start/reset time.

The command to use is ZB_WRITE_CONFIGURATION (Simple API) and each command should cause a ZB_WRITE_CONFIGURATION_RSP response from ZNP. Refer to [R2] for the structure of the ZB_WRITE_CONFIGURATION message and response (in the doc, “SREQ” is the request and “SRSP” is the response). The values for ConfigId are hidden in section 5.3 of [R3]. Note that Z-Tool expects the configIds to be provided in decimal form!

The following should be set:

  • ZCD_NV_LOGICAL_TYPE (configid=0x87=135d), value=0x02 for end device.
  • ZCD_NV_PAN_ID (configid=0x83=131d), a value of 0xffff means “don’t care”, which is appropriate for a single PAN environment as we want the device to join any PAN it finds.
  • ZCD_NV_CHANLIST (configid=0x84=132d), value = 4 bytes bitmask of channels to use. The LSB is channel 0, so the bitmask for just channel 11 would be 0x00 00 08 00. This is the compiled default and leaving it as-is does not stop the end device connecting to a coordinator on a different channel. Setting ZCD_NV_CHANLIST to match the coordinator channel will reduce scan-and-connect-to-PAN time because the end device will try channels in ZCD_NV_CHANLIST first, and then try others. I use channel 16 = binary 1 0000 0000 0000 0000 = 0x00 01 00 00. Note that in both Z-Tool and in the raw ZNP message, the value is set in little-endian byte order, so the bytes to send (in order) for channel 16 would be 00, 00, 01, 00 (remembering to use decimal form of each byte in Z-Tool).

I also set the ZCD_NV_POLL_RATE. This modifies the interval with which the device contacts the coordinator with IEEE 802.15.4 “Data Request” packets once joined (see Wireshark sniffer). The compiled default is 1000ms. THe documentation wrongly states this is config_id 0x24 and has 1 byte length. It is actually config_id = 0x35 and is a 4 byte value (in ms) expressed in little-endian form! I use a value of 15s, which matches the PTVO firmware. Expressing in ms and in little-endian order, this requires the series of bytes: 0x98 0x3A 0x00 0x00.

A likely cause of problems when “messing about” is caused by the way ZNP stores network state in non-volatile memory. While this is a good thing for devices in real use, speeding up their re-connection, it is helpful to always have a clean start if messing about… So, for experimental work, set the ZCD_NV_STARTUP_OPTION (configid=3) to a value of 2. This will clear the network state on restart. Issue a ZB_SYSTEM_RESET command to clear state immediately.

At this point the ZNP board is still unconnected from the network. It is not joined to a PAN and you will not see any network traffic to/from it in Wireshark (or other sniffer).

Joining a PAN

This involves two steps: first declaring to ZNP what “clusters” it offers/consumes, and second is telling ZNP to attempt to join a PAN.

There are some concepts and associated names for them which need to be understood before the first step can be completed.

Endpoint is a way of identifying separate features offered by a single physical device (identified by its MAC address and two byte PAN-network address). Consider an endpoint as a “virtual” device which shares a single physical device. For example, a Zigbee device controlling three separate lights would have three endpoints.

ClusterId is a way of identifying the set of attributes which a device feature supports. A simple on/off device has a cluster id of 0x0006. There is a Basic Cluster, id = 0x0000, which all devices should support. The Z2M “interview” involves the coordinator sending requests to read attributes in the Basic Cluster such as the device model and manufacturer. See [R5] and [R6].

InCluster, OutCluster, Server, Client are very confusing terms used in the Zigbee specifications. They often seem to be the wrong way! One way of deciding what they should be is to create a device using PTVO Configurable Firmware builder and then observe the messages using Wireshark. The InCluster list contains “server” features and the OutCluster list contains “client” features. Some examples: a light is a “server”, so is set up as an input cluster; a switch is a “client”, and a temperature sensor a “server”. I see that PTVO devices put the Basic Cluster as both an input and output cluster, but thinks work just fine with it defined as only an input cluster.

The first step, declaring the clusters uses the AF_REGISTER command (use Z-Tool), with the following values:

  • Endpoint = 1 (actually a free choice, but 1 seems logical!)
  • AppProfId must be set to the Home Automation Profile ID, which is 0x0104.
  • AppDeviceId should be chosen from the values given in [R5]. I used 0x0000.
  • AppDevVer can be freely chosen.
  • Set a length of 1 for the InClusters list and add the Basic Cluster Id.

After defining the endpoint, set Z2M to accept join requests and start Wireshark (remember to set the channel to match the Z2M coordinator).

Now for the second step. This will trigger network activity and a series of ZNP callback messages to inform you of the progress of joining. The command to use is ZDO_STARTUP_FROM_APP, setting a delay of 0 (appears as “Mode” in Z-Tool). The ZNP callbacks should comprise one ZDO_STARTUP_FROM_APP_RSP (with a network status code of 1) and several ZDO_STATE_CHANGE_IND messages. The status codes given by ZDO_STATE_CHANGE_IND are not in the documentation but can be found by referring to Components\stack\zdo\ZDApp.h in your Z-Stack 1.2 installation (find the devStates_t enum). The values I see follow the pattern: 2 DEV_NWK_DISC {potentially repeated} -> 3 DEV_NWK_JOINING -> 5 DEV_END_DEVICE_UNAUTH -> 6 DEV_END_DEVICE. Z-Tool incorrectly decodes status = 2 as “INVALID_PARAMETER”. If you see status 2 arriving multiple times it means you did not set the channel list to match the coordinator, and if you only ever see status 2, the coordinator is probably off-line or not accepting join requests. Status 6 means the device has joined the PAN as an end device and it should appear in the Z2M web interface.

You will now see a bunch of AF_INCOMING_MSG messages. These are from the coordinator to the ZNP device and are caused by Z2M’s “interview”, which is trying to read the attributes in the Basic Cluster. It will eventually give up. The ZNP board is now joined into the PAN but is not properly described in Z2M and can do nothing useful. Still: getting this far is an achievement.

Aside: there are also Simple API commands for this process, but I find the responses less informative.

Message Log

Here are the raw ZNP messages sent over UART and the responses (generated by a Python script – see Part 2). The responses have been parsed out to command + body, whereas the TX bytes include the SOF and FCS.

TX: fe 03 26 05 87 01 02 a4
[Response] RX body: Cmd: 6605 Body: 00
TX: fe 04 26 05 83 02 ff ff a6
[Response] RX body: Cmd: 6605 Body: 00
TX: fe 06 26 05 84 04 00 00 01 00 a4
[Response] RX body: Cmd: 6605 Body: 00
TX: fe 03 26 05 03 01 02 20
[Response] RX body: Cmd: 6605 Body: 00
TX: fe 06 26 05 35 04 98 3a 00 00 b6
[Response] RX body: Cmd: 6605 Body: 00

And here is the AF_REGISTER and “start”.

TX: fe 0b 24 00 01 04 01 00 00 01 00 01 00 00 00 2b
[Response] RX body: Cmd: 6400 Body: 00
TX: fe 01 25 40 00 64
[Response] RX body: Cmd: 6540 Body: 01

In Wireshark, you should see an Association Request, followed (but probably not immediately) by an Association Response. Note that the protocol is IEEE 802.15.4, rather than “Zigbee”, as these are network-level interactions. See that the request and response source and destination use a MAC address and that the short address (2 bytes) which will subsequently be used (and is shown in Z2M) is provided in the response.

Further down the Wireshark log, you should see a “Transport Key” message being sent to the short address, now given as “Zigbee” protocol, followed by a “Device Announcement” where the newly-joined device broadcasts its presence.

To be Continued…

Part 2 will look at the request and response messages involved in the Z2M “interview”, and beyond to build a simple device to demonstrate reporting and remote control.
Zigbee from a DIY/Maker Perspective – Low Cost Experiments

My perspective on Zigbee is one of a DIY-er and Maker; I’m primarily interested in making my own devices, rather than doing things with commercial devices. This means, among other things, that I definitely do not want to be reliant on proprietary “hub” software and want to keep control over complexity and cost. What follows are some brief notes on the technology choices which worked for me. The XBee platform looks a bit pricey, especially if the ultimate plan is for multiple DIY devices. This post condenses quite a bit of desk research and experimentation (I didn’t already have a Zigbee network, so started from zero); I hope it provides other people with a “jump start”. I won’t explain basics, so if you don’t already know what “coordinator”, “router”, and “end device” signify in a Zigbee network, look here.

The E18 modules from EByte are available in a number different models and I opted for the quite economical E18 MS1 PCB (this has a PCB antenna, whereas the similarly-priced E18 MS1 IPX has an IPX socket for an external antenna).  Current (July 2023) prices on Aliexpress for E18 MS1 PCB, are: £2.61 or $3.18 + tax. Other options are available with power amplifiers, but for experimenting, the MS1 is just fine and I’ll only pay the extra (and suffer lower battery life) if I find a need. When I say E18 below, I will be particularly referring to the E18 MS1, although the comments may apply to other models.

The basic E18 module is in the form of a surface mount “stamp”, so I made some breakout boards to expose its many GPIOs. I made lots, so am selling on ebay. I’ve written a separate post about these boards, which contains a link to the ebay listing and to a github repository with Eagle CAD files (if you want to get your own boards made).

The big challenge with using the E18 is firmware. The factory firmware is quite specific and limited in what it can achieve, although it takes quite a while to work this out from studying the manual; it is intended for “transparent” data exchange between devices. This is not a good match for the kind of home automation devices which I’m interested in, and which I suppose most DIY/Maker types are. Another issue is that it is impractical for hobbyists to compile source code for the CC2530, the Texas Instruments system-on-chip which is the heart of the E18, because you need the IAR IDE costing several thousand dollars. However: the good news is that someone has produced a configurable firmware generator: PTVO. Another option is to use the Z-Stack “Zigbee Network Processor” (aka ZNP). This also avoids the need to compile for the CC2530 but is nowhere near as easy to use as the PTVO configurable firmware generator, so I will write a separate article on using ZNP.

PTVO Configurable Firmware is extremely helpful in that you set up how the GPIOs should be used as inputs and outputs, including use of multiple I2C sensors and more. It does all this without needing you to use a separate microcontroller; a single E18 (or similar) module interfaced to switches, sensors, indicators, etc is all you need. There are a few things which the free version cannot do, but the “premium” version is not at all expensive. Practical battery-powered end devices will require the premium version for the power saving mode; without this, I have measured PTVO firmware devices consuming over 70mA continuously.

The PTVO tool can also generate the converter JS files needed by Zigbee2MQTT (see below), which is very helpful indeed, since the documentation on writing these youreself is rather sketchy. While these converter files seem to mostly work “out of the box”, the one generated for a basic switch is not compatible with the firmware which is generated. I raised an issue on github but the developer didn’t seem to consider incompatible output to be a bug. One limitation of the PTVO firmware is that you can only use the devices which it supports and in the way it supports them (e.g. you cannot control over-sampling and other noise-reduction techniques). If these are issues then a resort to ZNP and a MCU with your own code to interface with the sensor/display/actuator is the easiest way ahead.

In addition to the E18s, which will be the heart of my Zigbee devices, I also obtained:

  • The Ebyte E18 USB dongle (CC2531 chip), model E18-2G4U04B, for use as a Zigbee message sniffer. The pre-installed firmware works with the Texas Instruments Sniffer software (version 1, not version 2!) but this is not much use as it cannot decrypt encrypted messages. So: I installed the ZBOSS sniffer firmware and use the ZBOSS extension for Wireshark (see setup notes on Zigbee2MQTT site). This works mostly nicely and is quite informative. You DO need to select the right networking channel (the default in Zigbee2MQTT is 11, but I changed to 19 to reduce WiFi interferrence). Note that this hardware is not well suited to running the Zigbee 3 coordinator firmware or supporting many devices, and is quite low power (specifics are documented on the Zigbee2MQTT site).
  • A bundle comprising another CC2531 USB dongle (but this one with an external antenna, and intended to be the network coordinator), a CCDebugger and associated connection cables AND an adapter PCB with 0.1″ and 0.05″ headers. There are plenty of these on ebay, Aliexpress, and Amazon. I installed the Z-Stack 1.2 HA coordinator firmware on this dongle using the CCDebugger and TI Flashing software (this is where the 0.1″ to 0.05″ adapter board and cables come in). I also found that the Ebyte dongle had a single row of 0.05″ spacing holes for programming and was able to slide these over 5 of the 10 pins on the adapter board and then make ad-hoc connections to the programmer. This worked first time, and is much cleaner than solding “Du Pont” cables as suggested on the web.

On the question of programmers: I think the CCDebugger is the easiest way and, when bundled with the adapter and dongle is a “no brainer” purchase if you’re getting set up from scratch. I have also used other options with a Raspberry Pi, Flash-CC2530 (see my other post), and if you conduct a web-search for “CCLoader” + “ESP8266” or “Arduino”, you will easily find ways of using those MCU platforms as programmers. Some of these are for the CC254x devices, but the communication protocol is the same. Use “.hex” (Intel Hex) files with TI SmartRF Flash Programmer and “.bin” files with the other options. If you need to create bin from hex files, try using hex2bin (noting that you may need to use padding pad). The CCDebugger and Flash-CC2530 also show you the chip id, which can be helpful to find out whether there is a CC2530 or CC2531 inside (or not). Chip Id helped discover that multiple BLE modules I bought had mis-labelled chips as well as incorrect firmware: total fakes! Whatever you use for programming, only the DD, DC, and Reset signals are needed (in addition to Gnd and supply). If you use the CCDebugger, note that it provides a 3.3V power supply but also has a Vsens (read the manual!). I tend to program “out of circuit”, using the CCDebugger’s power supply and simply connect Vsens to the debugger’s power supply.

Now to the important question of the coordinator, and the bridge between planet-Zigbee and the rest of the universe. Zigbee2MQTT is freely available and non-proprietary and has some nice features:

  • It provides a bridge to a MQTT broker. This is a smart move for integration of different sense-and-control technologies. In my case, I already have a MQTT broker running as part of my Open Energy Monitor (inside it has a Raspberry Pi3) and I have co-opted the broker to be a hub for several air quality and temp+humidity sensors around my house and garden based around the ESP8266 Wifi MCU. There are numerous PC and Android (and doubtless Apple) Apps which can subscribe and publish to MQTT and I’ve written several Python dashboards using Plotly Dash and the Paho MQTT package. Using MQTT allows you to integrate Zigbee and non-Zigbee “worlds”, although the interactions will not be as rapid as a pure Zigbee system. If you know nothing about MQTT: find out!
  • It can run on a Raspberry Pi v3 or v4 (but not my old v1). I run it in a RPi v3 with its WiFi turned off, and have not had to resort to a USB extension cable for the coordinator dongle (some people recommend such an extension to avoid radio frequency interferrence).
  • It has a nice web interface which can be used to monitor the Zigbee network, inspect device status, control devices, and “bind” devices together.
  • Kantor Koen (the brains behind Zigbee2MQTT) provides firmware for the coordinator.
  • Mostly good documentation, although I could not get it to install on Windows 11 by following the instructions and the documentation on writing converter JS files is not adequate (not that this is a problem when the PTVO JS files work).

The question of radio frequency interferrence is referred to on the Zigbee2MQTT website, forums, and elsewhere but much of the information is unhelpfully inaccurate due to omission of caveats. The core issue is that WiFi and Zigbee share the same frequency band. I have widely seen that the assertion that there are only three non-overlapping WiFi channels: 1, 6, and 11. The central neglected caveat is that in the USA, unlicenced use is limited to channels 1-11. Much of the rest of the world can use channels 12 and 13. So, while 1, 6, and 11 are the sensible choice for optimal separation in the USA, there are actually 4 non-overlapping channels elsewhere: 1, 5, 9, 13 (a separation of 4 channels is quite adqeuate). This gives scope for operating 3 WiFi channels AND having uncontested space for a Zigbee network. NXP also has an application note (pdf) which shows the results of experiments on WiFi/Zigbee interference which suggests that concerns about wide “sideband” noise are not really warranted if you are using “802.11n” WiFi.

Summary

Ebyte E18 USB (CC2531) dongle and ZBOSS for a Zigbee sniffer.

Another CC2531 USB dongle with an antenna running Z-Stack 1.2 HA coordinator firmware attached to a Raspberry Pi v3. This is a bit low powered for serious use, but is fine for experimenting, prototyping, and small-scale use; I’ll upgrade if needed.

E18 modules on my breakout PCB runing PTVO firmware as “terminal” devices.

[optionally also E18 modules with PTVO “router” firmware, although I might end up using yet more USB CC2531 dongles as routers on the grounds that they are easy to power]

Zigbee2MQTT running on a Raspberry Pi v3 (in my case I used the MQTT broker on my Open Energy Monitor, rather than running on the same Pi).

For monitoring and publishing MQTT while experimenting I tend to use MQTT Explorer on my Windows PC. There are several Android apps which can do plotting, dashboards, and control widgets; some are better than others, depending on what you want…


TP-Link TD-W9970 “Error code:1 Internal error” – Solved

When trying to change WiFi settings on my TP-Link TD-W9970 v4 I got “Error code:1 Internal error” (and one button saying “OK”; it is not OK!). The TP-Link forms indicate I am not the first, but the TP-Link support people haven’t given any useful advice. Taking a backup of settings, resetting, and restoring the settings DID NOT fix things… just a waste of time.

Eventually, I stumbled upon the solution: I enabled the “Guest Network”.

Then I could change WiFi settings, especially the way the default “auto” settings are for a 40MHz bandwidth on an auto-selected WiFi channel (which is not helpful for managing multiple access points and a Zigbee network). The Guest Network can be turned off again afterwards.

Hooray!

Breakout Board for E18 Modules – DIY Zigbee at a Fraction of the Cost of an XBee

Having recently wanted to get my hands dirty with DIY Zigbee – see my other post on low cost DIY Zigbee – I couldn’t find any suitable breakout boards so, after having found the CC2530-based Ebyte E18-MS1 modules (which are rather economical and available from the manufacturer on Aliexpress… and seemingly without the curse of a glut of clones and fakes), I decided to make my own.

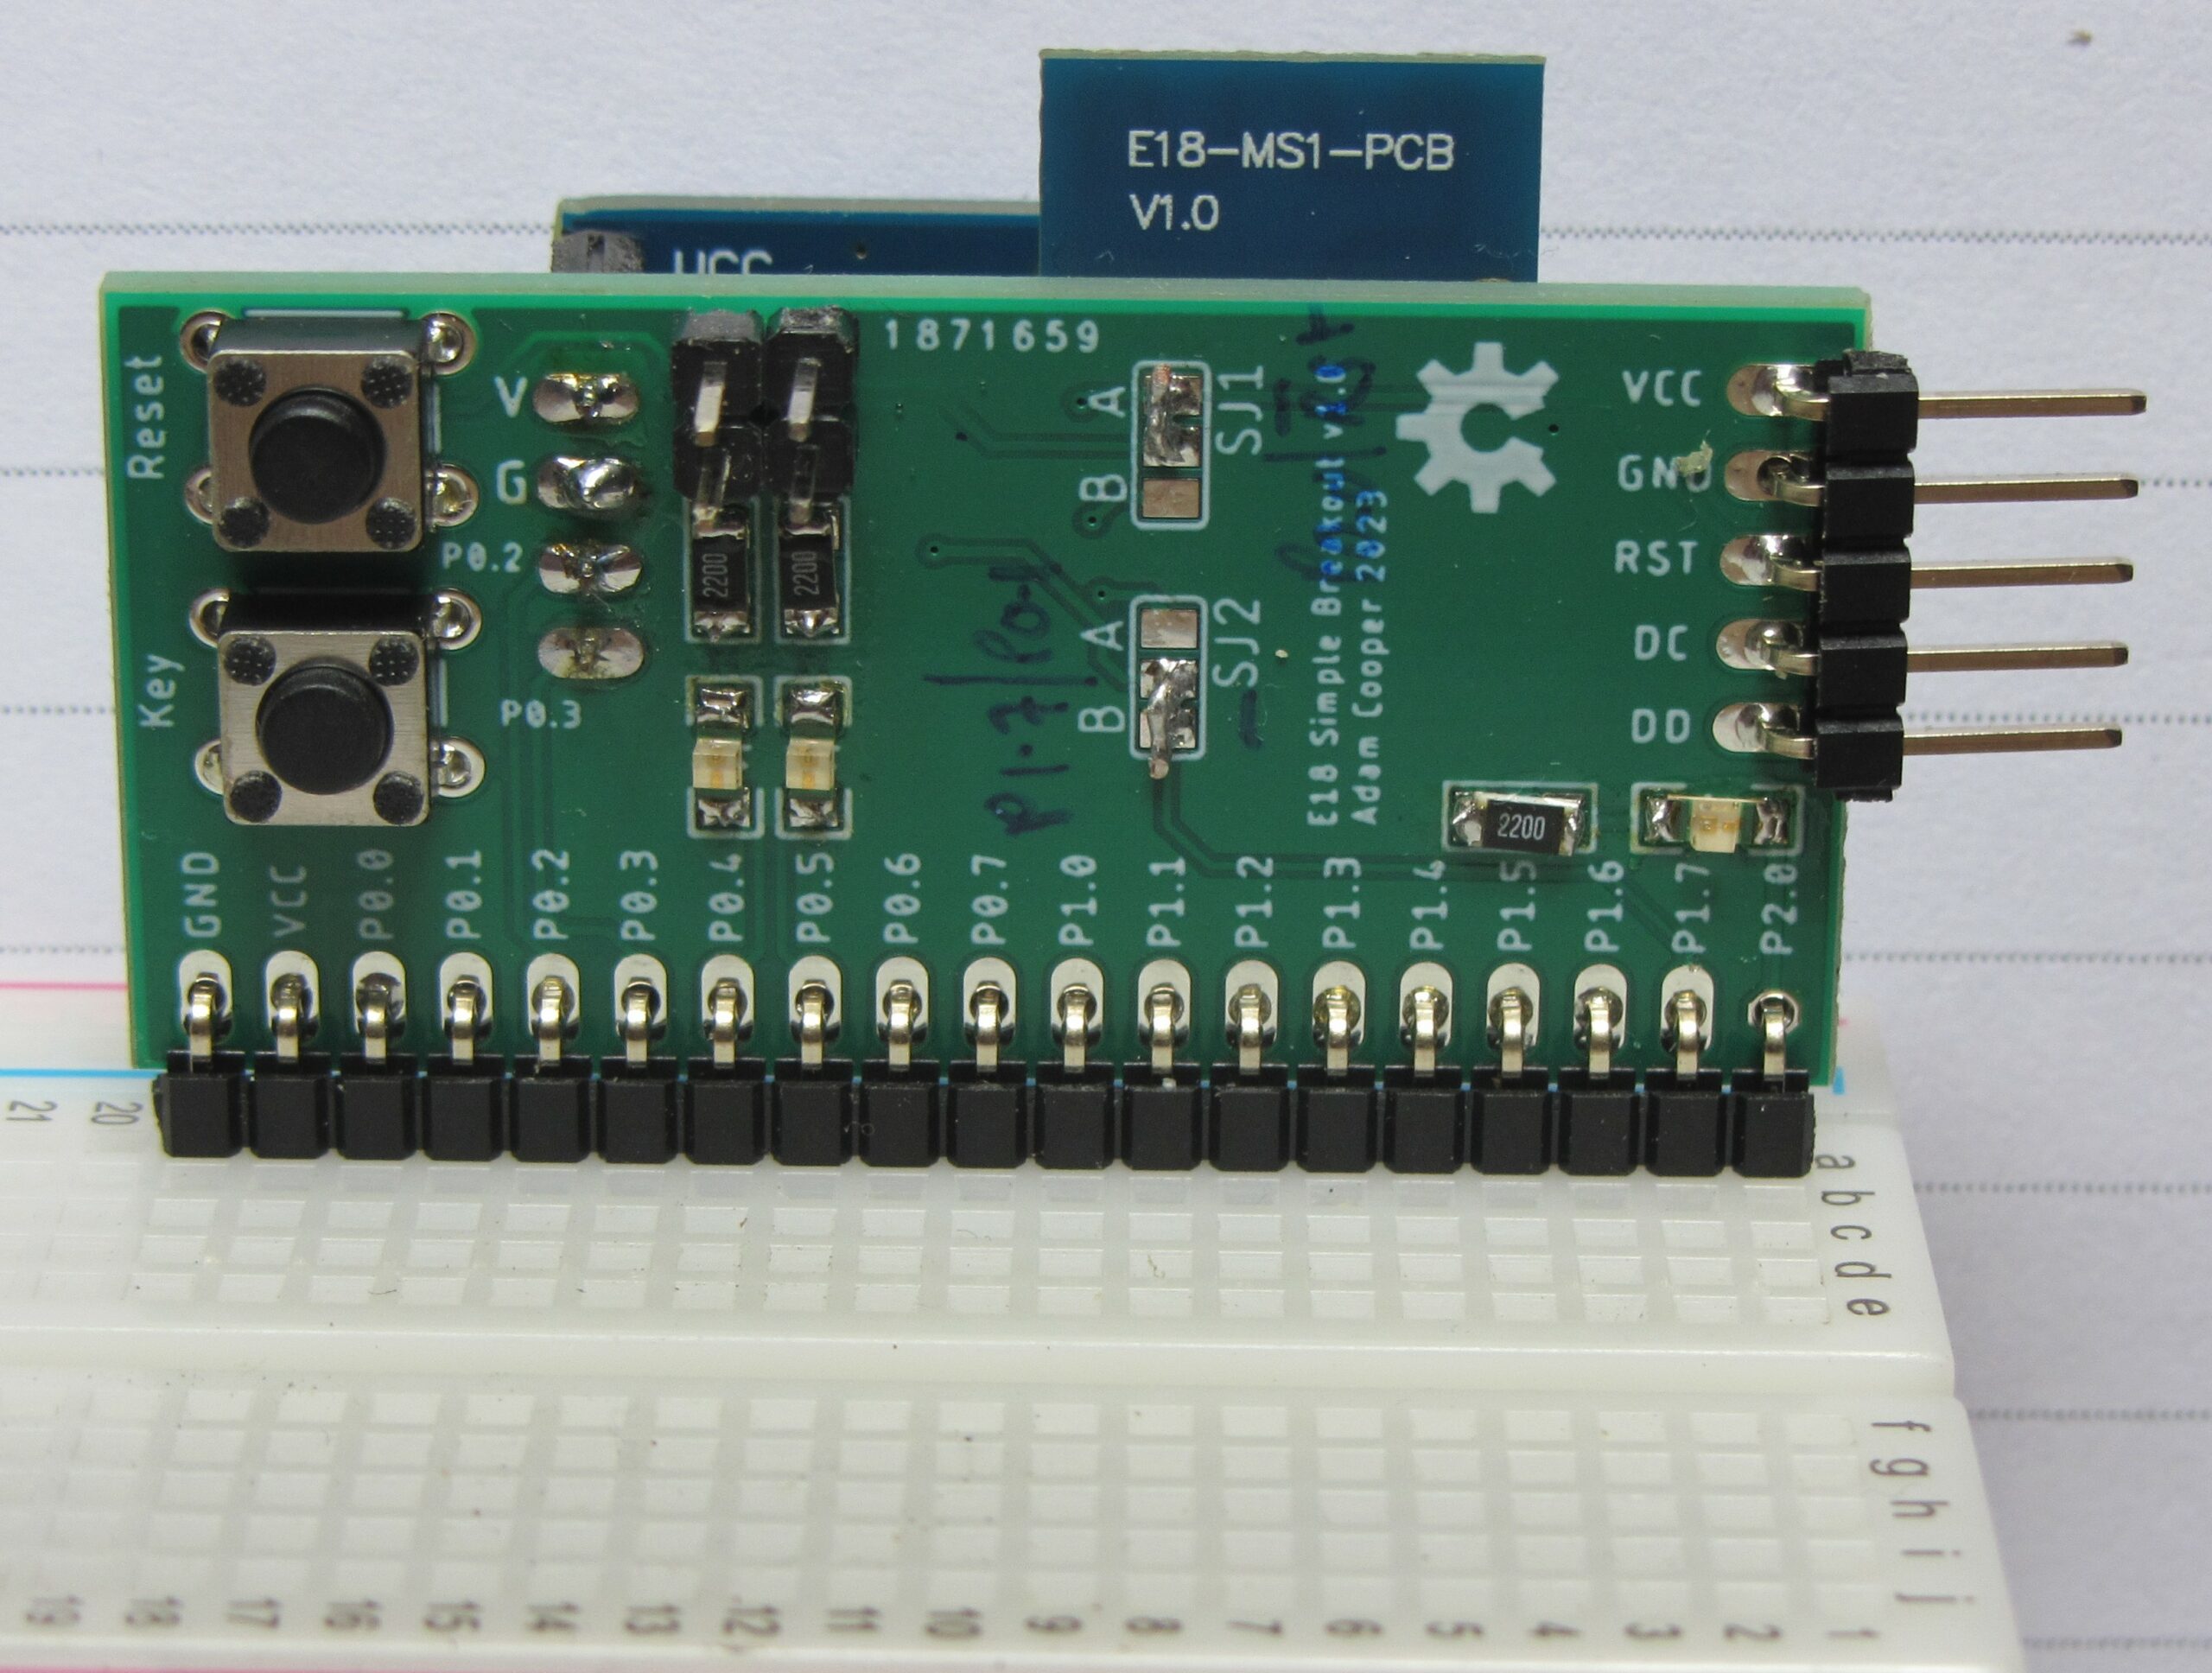
I wanted something quite simple but also flexible, with maximal scope for experimenting and learning. The main use case is to plug into breadboard but there was enough PCB space for some “convenience” components: two switches and three LEDs and associated resistors.

This is what it looked like once assembled (you can just see a BH1750 I2C light sensor on the rear):

Some notes on motivation, layout pragmatics, and options:

  • The long header is meant to be populated with right-angle pins. This will put the antenna nicely up and leaves plenty of space for other components on the breadboard (I find the breakouts with very wide dual-in-line pin-outs to be rather irritating, and Arduino style sockets and flying leads are not great when more than a few connections are to be made).
  • The 5 pin header is for firmware flashing. I opted for this, rather than the full 10 pin “debug” header which CCDebugger uses, for econonmy of space. These 5 pins are quite sufficient for using CCDebugger with TI SmartRF Flash Programmer (I made a little adapter) or if using something like Flash CC2531, which works fine for CC2530’s, (or my patched version for use with Pi v1 GPIOs).
  • The 4 pin header may be convenient for either UART or I2C connections. I’m expecting to be using PTVO and for the CC2530 it fixes UART pins to be P0.2 and P0.3. This header is meant to be mounted on the same side as the E18 module (opposite to switches).
    • The switches should be configured using the solder jumpers.
    • SJ1 handles the “Reset” button: A connects to E18 Reset; B connects to P0.0.
    • SJ2 handles the “Key” button: A connects to P0.1; B connects to P1.7 (which is used by the E18 factory firmware).
    • The on-board LEDs (and the enabling jumpers) visually correlate with the pins they are connected to: P0.4, P0.5, and P2.0.

Eagle design files are available on github but I am also currently (July 2023) selling surplus PCBs on ebay.

Connecting a Raspberry Pi (etc) Direct to a PC with a USB-LAN Adapter

There are a number of articles on the web which describe how to connect a Raspberry Pi direct to a Windows PC with a USB to LAN adapter. This can be quite handy when tinkering, especially with an original version 1. This article is quite good but I struggled to make it work. This article explains the problem and solution… but read that article first, as I don’t explain a few things!

The root of the problem is that I was using a USB to LAN adapter. It appears that Windows (Windows 11 at least) does not trust these devices because the network is fixed as being “Public”; I could not find a way to change this. The second part of my initial downfall was that when TFTPD64* started up, and Windows Firewall popped up the “public or private network” challenge, I thought nothing of allowing it to proceed with “private”. Thus, the firewall is between my USB-LAN dongle and the DHCP server.

* – an alternative is OpenDHCPServer.

If, like me, you missed the chance to choose “public” when starting the DHCP server software, you need to find your way into Windows “Settings”, then “Privacy & Security > Windows Security > Firewall & network Protection > Allow an app through firewall” (take a breath)… click the “Change settings” button then scroll down the list and enable the entry for tftpd64 or opendhcpserver for “public”.

Oh: one thing which the article above was not clear on was to use a different subnet ip address for the USB-LAN dongle than the PC is on. e.g. if your PC is 192.168.1.4, don’t use any 192.168.1.* address for the static IP entry.

And What About Internet Connection?

While the procedure in the above-mentioned article is fine for accessing the Pi from your PC, as soon as you need to access the internet from the Pi, it is aparrent that you can’t! Network interactions time out because there is no route for network traffic from the dongle adapter to the PC’s LAN/WiFi.

This is easily solved using “Sharing”. First thing: shut the Pi down. Starting with your PC’s “real” network adapter, right-click > Properties > Sharing (tab) > select the top “Allow” and choose the dongle for “Home networking connection”.

This will change the dongle’s IP addres so a return to TFTPD64 will be required to change settings, after which the Pi can be powered on again to get its new IP address. Changed settings I used:

  • IP pool start address = 192.168.137.100
  • Def router (Opt3) = 192.168.137.1

Watching the TFTPD64 log I noticed that it allocates two IP addresses. I suspect the first one (it had MAC address 00:AB:00:00:00:00, which is not normal!) is part of WIndows’ sharing magic. The other one should have your usual (and of course remembered!) Pi’s MAC. For me this was 192.168.137.101


Debugging ESP8266 with GDB and VSCode + Platformio

VSCode with the Platformio IDE plugin makes for an excellent platform for developing ESP8266 code, especially using the Arduino Framework for ESP8266 but the Platformio debugging features do not work. It is, however, possible to use GDB together with VSCode and Plaformio to be able to single-step through code, inspecting flow of control and variable values as you go, in an experience that is comparable to VisualGDB but costs nothing.

There are some limitations, “gotchas”, etc, but once these are understood it really does work!

Setting Up Debug Compilation

The program must be compiled differently for debugging to work because additional information must be included, along with the GDBStub (see below). Once debugging is over, however, the firmware uploaded to the ESP8266 should not have this overhead.

Allowing for both options to be compiled and uploaded is easy in Platformio if you use platformio.ini environments. For example:

[env]
platform = espressif8266
framework = arduino
upload_port = COM15
upload_speed = 115200
monitor_port = ${env.upload_port}
monitor_speed = ${env.upload_speed}

[env:d1_mini_pro]
board = d1_mini_pro

[env:debug_d1_mini_pro]
board = d1_mini_pro
build_flags = -Og -ggdb3 -g3 -D WITH_GDB
Note that I have created two targets – “d1_mini_pro” and “debug_d1_mini_pro” – with the latter defining some non-default build_flags. The “-g” flags make the compiler include debug information, while -Og prevents the compiler optimising code (which breaks the nice relationship between lines of source code and compiled MCU code). I have also included “-D WITH_GDB”; the -D directive is equivalent to a “#define” in the source code and means we can use “#ifdef” to selectively include chunks of code depending on whether we’re using the debug_d1_mini_pro target or not.
Remember to recompile and upload before debugging any changes you make.

Adding GDBStub to Your Code

The GDBStub is code which executes on the ESP8266 to communicate with GDB running on your PC via the serial port. Serial.print() will still work so long as you avoid using a rapidly-repeating loop() which contains little more then Serial.print().

The Arduino Framework already contains the GDBStub code and their documentation explains the basics, although in the context of using the Arduino IDE.

Following on from the use of “WITH_GDB” in the previous section, add the following chunks of code.

At the top:

#ifdef WITH_GDB
#include <GDBStub.h>
#endif
At the start of setup():
  Serial.begin(115200);  // or whatever baud rate you prefer
  #ifdef WITH_GDB
  gdbstub_init();
  #endif

Command Line GDB

An essential truth is that you must use the correct gdb for the core processor of the ESP8266: xtensa-lx106-elf-gdb.exe. For my Platformio install, this can be found at (“~” denotes my home directory, i.e. C:\Users\Adam): ~/.platformio/packages/toolchain-xtensa/bin/xtensa-lx106-elf-gdb.exe

A second essential truth is that GDB needs to be set up correctly before you can actually debug. This is most easily done with a set of commands stored in a file, which I call “gdbcmds” and which should be created in the home folder of the Platformio project (i.e. in the same folder as platformio.ini). My gdbcmds file contains:

# ESP8266 HW limits the number of breakpoints/watchpoints
set remote hardware-breakpoint-limit 1
set remote hardware-watchpoint-limit 1
# Some GDBstub settings
set remote interrupt-on-connect on
set remote kill-packet off
set remote symbol-lookup-packet off
set remote verbose-resume-packet off
# The memory map, so GDB knows where it can install SW breakpoints
mem 0x20000000 0x3fefffff ro cache
mem 0x3ff00000 0x3fffffff rw
mem 0x40000000 0x400fffff ro cache
mem 0x40100000 0x4013ffff rw cache
mem 0x40140000 0x5fffffff ro cache
mem 0x60000000 0x60001fff rw
# Locate the ELF file
file .pio/build/debug_d1_mini_pro/firmware.elf
# Change the following to your serial port and baud
set serial baud 115200
target remote \\.\COM15

The ELF file location follows the pattern .pio/build/{target}/firmware.elf, where “{target}” matches the relevant entry in platformio.ini.

Obviously: change the serial port and baud rate!

Now open a new terminal in VSCode. It should open with the project home as the working directory (this is necessary). You can open a terminal window outside VSCode too (I like ConEMU) but should make sure the working directory is right.

You need to run xtensa-lx106-elf-gdb.exe, passing the commands file by adding “-x gdbcmds”. I tend to use a bash shell, so the command is:

~/.platformio/packages/toolchain-xtensa/bin/xtensa-lx106-elf-gdb.exe -x gdbcmds

If you prefer a normal Windows command prompt just replace the “~” with C:\Users\You.

If you get an error like “\\.\COM15: No such file or directory.” then you will have the Serial port open somewhere such as the “Monitor”. Close it.

I suggest you read the Arduino Framework notes for “what next”. The GDB documentation is available online but is rather long and has much which is not applicable. Generally useful commands are: thb (see below), next, step, finish, print, and info locals. Interesting to explore are: disassemble and frame.

When single-stepping (step or next), the execution will sometimes step over several lines of code.

Avoid resetting the device while a GDB session is connected; it gets rather confused!

ESP8266 Limitation – One Breakpoint

This causes things to get ugly if you don’t work with care. The first thing to do is to use temporary breakpoints. Rather than the normal “break” GDB command, use “thb”. This means that once the breakpoint has been reached it is deleted. Otherwise you need to use the “delete” command to remove the breakpoint.

Typical uses are to break on entry to a function. So long as the function name is unique, something like “thb loop” works. Since the compiled code contains source from many files, line numbers must identify the file they relate to, so the command should be something like “thb src/main.cpp:25”.

“Visual” Debugging

This is how to get the debugging experience more like what the Platformio and VisualGDB screenshots suggest.

The launch.json file (within the .vscode folder for the Platformio project) should be edited. Ignore the warning about this being an automatically-generated file and replace the platformio debug entries with the following:

{
    "version": "0.2.0",
    "configurations": [
        {
            "name": "GDB",
            "type": "cppdbg",
            "request": "launch",
            "program": "${workspaceFolder}/.pio/build/debug_d1_mini_pro/firmware.elf",
            "args": [],
            "stopAtEntry": false,
            "hardwareBreakpoints": {"require": true, "limit": 1},
            "cwd": "${workspaceFolder}",
            "environment": [],
            "externalConsole": true,
            "MIMode": "gdb",
            "miDebuggerPath": "${userHome}/.platformio/packages/toolchain-xtensa/bin/xtensa-lx106-elf-gdb.exe",
            "miDebuggerServerAddress": "\\\\.\\COM15",
            "setupCommands": [
                {"text": "set remote hardware-breakpoint-limit 1"},
                {"text": "set remote hardware-watchpoint-limit 1"},
                {"text": "set remote interrupt-on-connect on"},
                {"text": "set remote kill-packet off"},
                {"text": "set remote symbol-lookup-packet off"},
                {"text": "set remote verbose-resume-packet off"},
                {"text": "mem 0x20000000 0x3fefffff ro cache"},
                {"text": "mem 0x3ff00000 0x3fffffff rw"},
                {"text": "mem 0x40000000 0x400fffff ro cache"},
                {"text": "mem 0x40100000 0x4013ffff rw cache"},
                {"text": "mem 0x40140000 0x5fffffff ro cache"},
                {"text": "mem 0x60000000 0x60001fff rw"},
                {"text": "set serial baud 115200"}
            ]
        }
    ]
}

Note that: the entry for “program” will need changing to match your debug compilation target; the serial port appears as “miDebuggerServerAddress” and has additional back-slashes compared to the previous configuration.

This uses the “machine interface” to GDB, which you can see by adding “–interface=mi” after the “-x gdbcmds”. There is a Python package which can interpret the gdb/mi responses: pygdbmi.

You should now be able to use the “Run and Debug” feature of VSCode; there should be an entry called “GDB” (using the “Quick Access” Plaformio Debug > Start Debugging also seems to work but I avoid that route as I don’t know what else it might do). I won’t repeat information on using the VSCode debugging interface here; there is plenty on the web! You should be able to see variables and to inspect the call stack while stepping through the code. What I will provide are some caveats and gotcha-avoidance measures.

Remember there is only one breakpoint

Unfortunately, VSCode does not let you set temporary breakpoints. So you must adopt a working practice of setting a breakpoint and then deleting it as soon as you get there (the config line ‘”hardwareBreakpoints”: {“require”: true, “limit”: 1}’  prevents you from adding more than one, but it isn’t that simple! It appears that the VSCode gdb/mi implementation uses breakpoints for “step over” operations, so you really must delete the breakpoint before stepping. If you get horrible red boxes popping up reporting exceptions etc, the cause is likely to be because you have left a breakpoint.

Where is my Serial.print() output?

In spite of the debugger, I still find Serial.print() very useful for reporting sensor readings etc.

These appear in the Debug Console.

Not all variables are locals

Although the VARIABLES panel shows local variables (and changes these as you select different levels in the call stack), global variables will need you to issue the GDB print command. Locate the Debug Console and note that it has a command entry line at the bottom. GDB commands may be entered here, but must be prefixed by “-exec” (e.g. -exec print foo). You can also add these as WATCH entries.

Adding a breakpoint while things are running

Adding a breakpoint while the ESP8266 is running causes it to stop execution where it is, rather than where the breakpoint has been added. Simply use Continue (F5) to make it continue until the breakpoint is met.

Some things don’t work

Although VSCode suggests otherwise, some things are not supported: PERIPHERALS, MEMORY, DISASSEMBLY.

The Debug Console command line entry comes to the rescue, e.g. try “-exec disassemble”.

Debugging Inside Setup

The problem with attempting to debug inside setup() is that the ESP8266 will normally have exited setup() before you connect GDB.

The neatest way of handling this is to add the following code into setup() just before you want to start debugging:

  #ifdef WITH_GDB
  gdb_do_break();
  #endif

When you reset the ESP8266, this triggers entry into the debugger on the ESP8266, which looks like a breakpoint hit, and means that when you connect GDB you find you are stopped inside gdb_do_break(). Send the “finish” command to GDB twice and you’ll be inside setup().

This works nicely with the command line use of GDB but I haven’t been able to find how to make the VSCode debugger play nicely with it. In this case, the quickest option is to use something like delay(3000) instead of gdb_do_break(). This gives you enough time to start the debugger after resetting the device.

Make sure you quit any GDB session before resetting; things get all messed up otherwise.

Setting Variables

GDB permits variable setting through commands such as “set var my_var = 5”.

Unfortunately, this does not always work. Various comments on the web suggest this comes down to where the variable data is to be found when the program is running, because GDBStub cannot access all possible places.

A work-around is to declare variables with the “volatile” keyword.

Creating Panelised PCBs in Eagle for Seeed Studio

After some misadventure and blind alleys I have an efficient and reliable approach to panelising PCBs in Eagle with v-scoring (v-cuts) to aid in board separation. I am using Eagle 9.6.2 (free version) and send PCBs to Seeed Studio.

The starting point is the Sparkfun-Panelizer ULP. Thanks for open-sourcing this, Sparkfun; I couldn’t have “got there” otherwise. Unfortunately, this completely bombed for me due to its failure to cope with space characters in file paths. This is easily fixed once diagnosed. Towards the end of the ULP, change the line which says sprintf(s, “SCRIPT %s;\n”, scriptFile); to say sprintf(s, “SCRIPT ‘%s’;\n”, scriptFile);. See that I added single quotation marks; what a difference two characters can make in progamming!

A second issue with the Sparkfun ULP is that component names get changed because the Eagle PASTE operation prevents name collision by assigning the next available number. The upshot is that each panelised board gets a different set of component names printed. Arghh! This does make sense if you think about these as being unique identifiers, as Eagle sees the whole composite as “one board”. I got around this using a tool already within Eagle.

The final issue is that the Sparkfun ULP was made for their scenario and there are lots of things which are irrelevant and the default settings need changing each time. I also didn’t want to adopt their workflow concerning design rules and CAM processor config. So I streamlined the script for me (I could do more; there is some cruft remaining). Here it is: Panelizer2

The Procedure

1. Prepare a New Layer with Component Names

From the board in Eagle: Tools > Panelize.

This does not actually panelize anything, but generates a script by iterating through all the components. The result of executing the script is that the component names are written into layers 125 (aka “_tNames” for top components) and 126 (aka “_bNames”) for bottom components). Since these are just written as text, they no longer need to follow the unique naming rule; they are not names!

At this point, show only the new layers and delete anything you dont want (I have found some component names which I deleted from the board re-appear in the new layers).

Also, be aware that:

  • items in the new layers are created every time the Panelize tool is run, so if you have previously run this Eagle tool, you should delete everything before running it again.;
  • several other underscore-prefixed layers may be created, based on attributes in layers other than name and value, and some of these maybe should be moved into layers 125/6 (or better, have their source layers changed to 25/6).

2. Run the Panelizer ULP

If the Sparkfun ULP works for you, go ahead. There is a tutorial on maker.pro. Or maybe you have spaces in your file paths and can use it with the fix noted above. Alternatively, if you are using Seeed Studio, try using my hacked version.

Run a DRC now!

3. Run a Modified CAM Process

The upshot of step 1 is that we have component names in four layers (two for the top and two for the bottom) and the ones which your usual CAM process rules will put into the silk-screen layer are the wrong ones. The change required is quite simple. Start by taking a copy of the “.cam” file and open it in a plain text editor (Notepad will do, but I prefer “Notepad++”).

You are looking for the occurrence of 25 or 26 within a “layers” structure. For example, a typical setup for a top silk-screen would include the placement and names and define this using:

“layers”: [
21,
25
]

Simply change the 25 to 125 (i.e. _tNames) and 26 to 126.

Then just run your modified CAM file in the CAM Processor.

Notes Concerning Seeed Studio

I’ve found them fast (accounting for shipping from China), cheap, and (so far) of good quality. I use the basic PCB service, which has a 100mm x 100mm standard board and panelisation of identical boards attracts no additional fee. There are some rules concerning panelisation which the revised ULP adopts.

Blind Alley

In addition to the gremlins with the Sparkfun ULP, I did attempt to use “gerbmerge”; I had used this quite a few years ago. This time I used gerbmerge3, which is an adapted version for Python 3 (the older version was Python2 which has not been maintained for several years). Unfortunately, after setting up the config files, while the program ran, it barfed on one of my gerber files due to a directive which it did not recognise: “%MOMM*%”. I failed to find out what the significance of this is and whether I could safely hack the code to ignore it… only to find there was some other similar issue… and a rat hole of misery.

Updating EmonPi to Continuous Monitoring

Continuous monitoring with the Open Energy Monitor EmonPi hardare us now possible (since Feb 2023), see: https://docs.openenergymonitor.org/emonpi/firmware.html. This gives a more accurate measurement of power than sampling at time intervals.

Unfortunately, the process is incompletely documented there and the forum contains several threads which contain errors, distractions, and diversions alongside the information to make the firmware update work. I certainly had to spend time disentangling things to arrive at what is actually a simple procedure, although the forum was a source of some trepidation. Also: do not be tempted into the compilation process described on that firmware web page.

NB: what follows is based on my EmonPi setup. I believe some details will be different for EmonTX + EmonBase setup.

First, ensure that your system is up to date using Setup > Admin > Update: Full Update. This does not change the firmware, but will change what you see available in the Update Firmware Only section. Once updated, you can select options in the drop-down lists in the Update Firmware Only. My hardware is an emonPi and I opted for the “RFM68 LowPowerLabs” radio format (as recommended). Upon hitting the “Update Firmware” button, various messages will appear in the log.

Once it has completed, you will see that there are no updates in Setup > Inputs or Setup > EmonHub. This is because the baud rate and message format have changed. In Setup > EmonHub, use the “Edit config” button to fix this. Changes to two sections are required.

Under “[interfacers]” will be an entry which seems to have gone under different names at different times and/or different hardware configurations. If you have an emonPi, look for the section which contains “com_baud = 38400”, “pubchannels = ToEmonCMS”, and “baseid = 5”. Mine is identified as [[RFM2Pi]]. If you do not have an emonPi then a different baseid will apply. I only changed the com_baud from 38400 to 115200. Leave the rest alone!

Scroll down and find, under “[nodes]”, a section “[[5]]” (matches the baseid above). Leave the “nodename” entry as it is but modify the lines under “[[[rx]]]” to read:

names = Msg, power1,power2,power1pluspower2,vrms,t1,t2,t3,t4,t5,t6,pulse1count,pulse2count,E1,E2
datacodes = L, h, h, h, h, h, h, h, h, h, h, L, L, l, l
scales = 1, 1,1,1, 0.01, 0.01,0.01,0.01,0.01,0.01,0.01, 1, 1, 1,1
units = n,W,W,W, V, C,C,C,C,C,C, p, p, Wh,Wh

Note that the scales line can be used to adjust the power values and Vrms which the emonPi records to accomodate systematic errors due to component tolerances; the text quoted above assumes that this calibration has not been done.

I found that simply saving the config and then using the “View log” button showed this worked. Some people state that EmonHub should be restarted, but I did not find this was needed.

Make a final check that things are working by visiting Setup > Inputs and looking at graphs, visualisation, your app etc. At this point, you might note that there are now two new attributes in the input data: E1 and E2. Unfortunately (again, argh!), the meaning of these (vs the pre-existing power1 and power2) is not properly documented and mentions in the forums are often roundly uninformative.

Peak District Mining History Field Guides

I have written a series of field guides to mining history (and some geology and other historical notes) for selected areas in the Peak District. Each guide consists of a written field guide, maps, and digital location data for GPS devices.

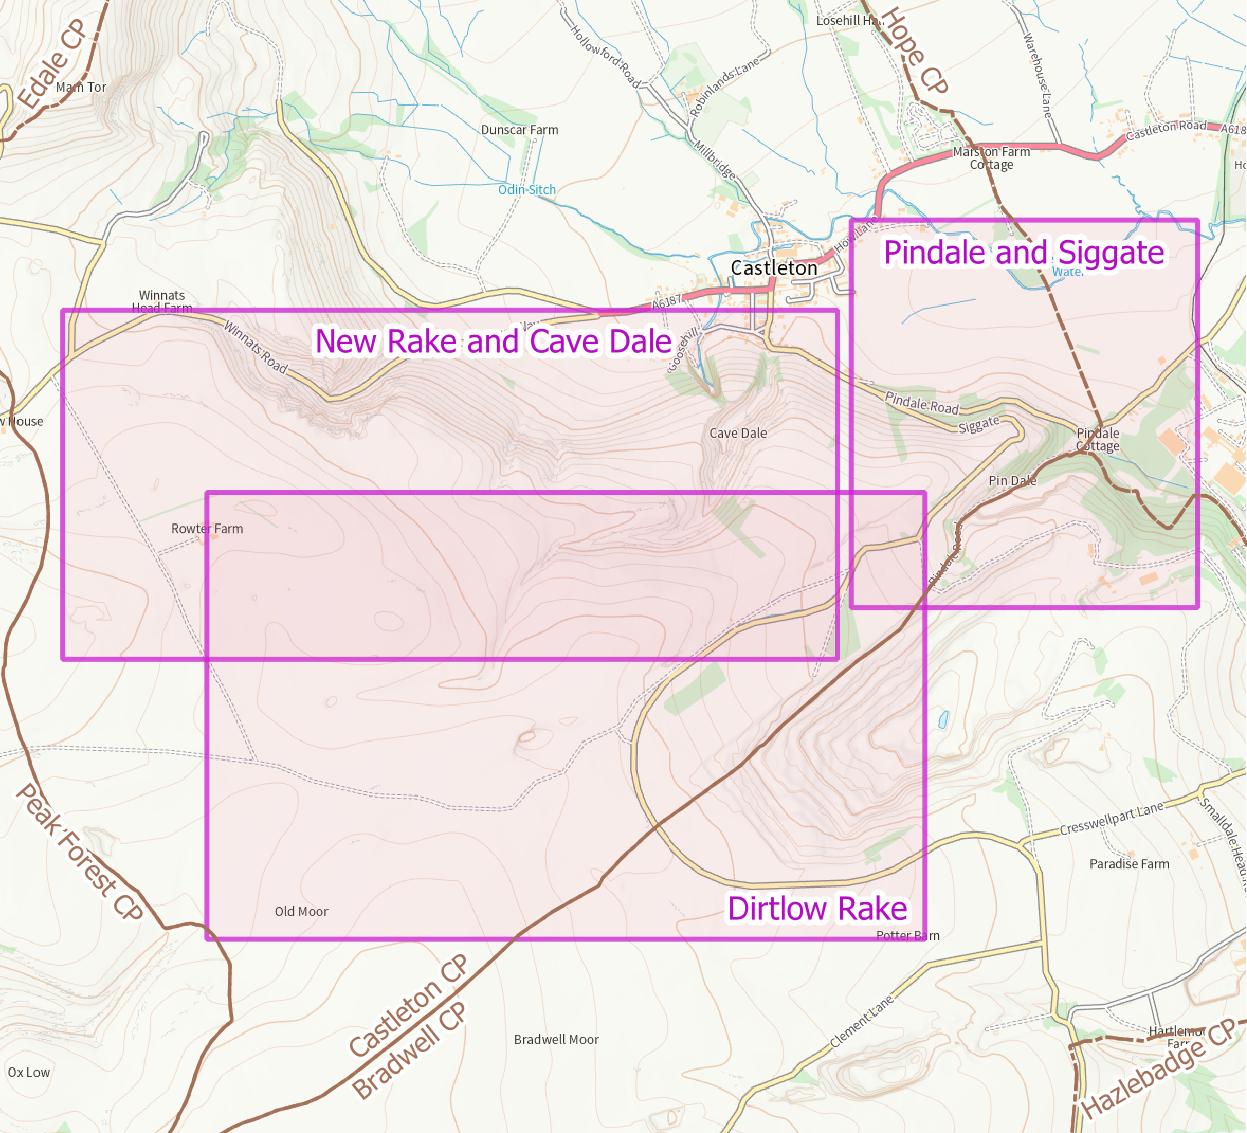
The first guide describes three itineraries near Castleton: New Rake and Cave Dale, Pindale and Siggate, and Dirtlow Rake.
Version 1.0 published May 2023.

The second contains two itineraries around Millers Dale: Maury Rake and Tideswell Dale.
Version 1.0 published December 2023. More itineraries are in preparation for Millers Dale.

The third looks at coal mining west of Buxton, specifically the area around Derbyshire Bridge in the upper Goyt Valley, above Burbage, and across to Thatch Marsh and Cisterns Clough.
Version 1.0 published January 2024.

Castleton Mining History Field Guide

This field guide contains three itineraries around mining history sites (and some geology and other historical notes) near to Castleton in the Peak District: New Rake and Cave Dale, Pindale and Siggate, and Dirtlow Rake.

The main download is a zip file which contains a written field guide, maps, and digital location data for GPS devices.


If you make use this guide, please let me know by adding a comment. You can also post corrections and suggestions (but please note I am unlikely to respond to requests for more information).

Links to all mining history field guides may be found on the Peak District Mining History Field Guides index page.