The next post will look at on-chip-debugging (OCD) but it is worth using the Atmel Studio Simulator first. Using the simulator isn’t practical unless the input-output is pretty simple because it doesn’t simulate attached devices or real-time events. But even so, you can fiddle with input/output at the bit level and follow the way variables in the code change as it executes. This is MUCH smarter than using Serial.println() because once you’ve mastered Atmel Studio, you can save plenty of time. And poking about with the simulator helps to make sense of what is going on inside code such as “int led=13” or “digitalWrite(12, HIGH)”. All clean fun, and you don’t need any hardware other than a PC.
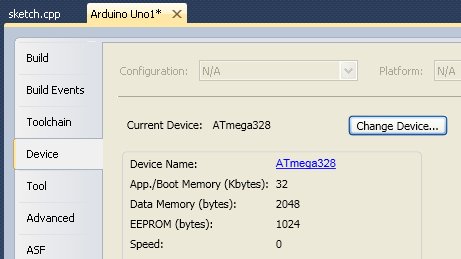
This starts off as just a case of compiling the code in Atmel Studio so you can set break-points or step line-by-line through the code to see what happens. See an earlier post of mine for how to get an Arduno sketch to become an Atmel Studio 6 project or just download the Atmel Studio project to match the following.
I have the “device and debugger toolbar” permanently enabled: ![]() .
.
Tracing Input/Output
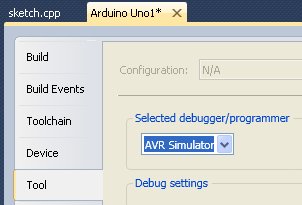
I’m going to use “blink” with delay() commented out because I have also found that use of delay() causes problems. Real time stuff doesn’t make sense in a step-through simulator anyway.
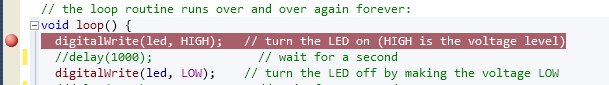
Now just hit F5 (or the green “play” icon) , watch the compile and wait for the break-point line to become highlighted in yellow. Now make sure the “IO View” is open. Use F10 to step through lines or the “Step Over” icon. If you F11/”Step Into”, you will end up inside the code that implements digitalWrite().
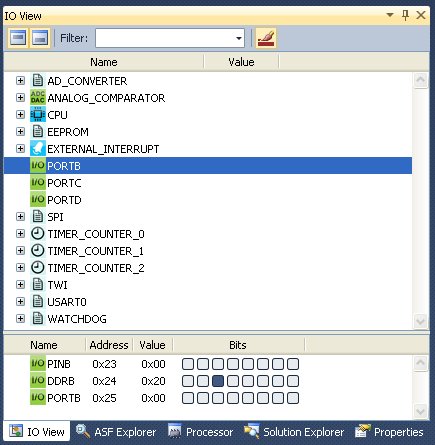
Step through and watch bit 5 change, with nice highlighting in red. You can also click on it to change the value manually. I tend to use keyboard shortcuts but you might prefer the toolbar: ![]() (watch, step-into, step-over and step-out). Step-Out is handy if you accidentally Step-Into the code for digitalWrite(), for example.
(watch, step-into, step-over and step-out). Step-Out is handy if you accidentally Step-Into the code for digitalWrite(), for example.
It should be an easy step to modify blink to read pin11 and write the value to pin12. Which bits of PORTB are these? Click on the appropriate bit in the PINB row to set the input value as high or low and step through to see it propagate to the output. Does it work if pin11 is set as an output (DDRB is set for that bit)?
Watching CPU Clock Cycles
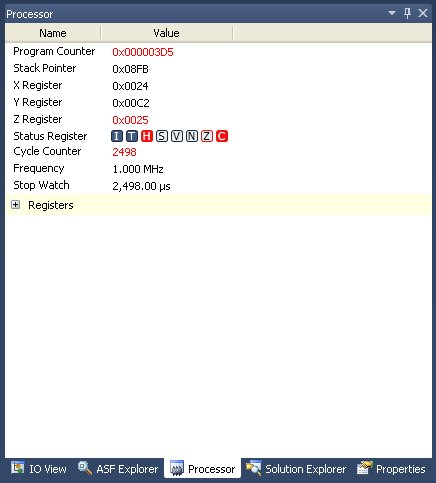
Open the Processor view and watch the “Cycle Counter” as you step through. Changes in this indicate how many CPU clock cycles were needed to execute the line(s) of code. You can over-type the value to zero. At 16MHz clock, each cycle is 1/16,000,000s long so it how long does it take for the two digitalWrite()s in blink to execute?
Watching Variables
Declare a boolean called “in” and read pin 11 into “in” before doing a digitalWrite(12, in). Now select the text “in” and add a “QuickWatch” (Shift F9 or click the glasses icon). Step through as before, manually changing bit 3 (pin 11) in “IO View”. NB: you can manually change values in the “Watch 1” tab too.
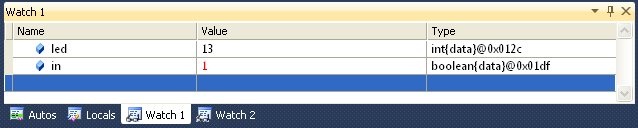
OK… that was too simple but… Now find the “Memory 1” view (try Debug|Windows menu) and select “Memory: data IRAM”. Step through again and see if you can see which memory byte stores the value of “in”. Hint: in my case it was address 0x01df. Now add a QuickWatch for “led”, find the memory location and check its value is 0x0d (i.e. hexadecimal for 13 in decimal). See what happens in the Memory view if you change the value of “led” in Watch 1 to be -1 or 512. It should be clear that “led” uses two bytes of storage (check the Arduino reference and it says “Integers … store a 2 byte value. This yields a range of -32,768 to 32,767”).
“And poking about with the simulator helps to make sense of what is going on inside code such as “int led=13″ or “digitalWrite(12, HIGH)”. All clean fun, and you don’t need any hardware other than a PC.”
AtmelStudio 6.2 seems to require a programmer and a serial line, and also uploads, when you try to use the simulator?
What about Arduino instructions like Serial.print(…)? How can they be traced within Atmel Studio Simulator? Somehow watching UDR?